
Page 105 - Standard Handbook Petroleum Natural Gas Engineering VOLUME2
P. 105
Formation Evaluation 93
The oil content (V,) divided by the pore volume (V,) yields the oil saturation
(So) of a sample in percent of pore space:
c; 1
so = - 100 (5-82)
Two sources of error are inherent in the retort method. At the high tem-
peratures employed, water of crystallization within the rock is driven off which
causes the water saturation to appear to be higher than the actual value. Another
error results from the cracking of the oil and subsequent deposition of coke
within the pore structure. Thus, a calibration curve should be prepared on
various gravity crudes to compensate for the oil lost from the cracking and
coking. Both of the above errors will result in a measured oil saturation that is
lower than the actual saturation in the rock. Another possible source of error
is the liberation of carbon dioxide from carbonate material in the core at
elevated temperatures; this would cause a weight loss that can be interpreted
as a change in saturation. The solvent extraction method has the disadvantage
in that it is an indirect method since only the water removed from the core is
measured. However the extraction method has the advantage that the core is
usually not damaged and can be used for subsequent tests.
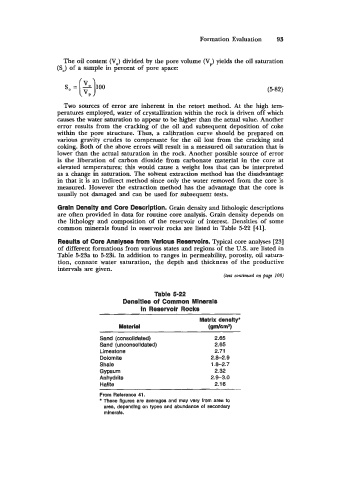
Grain Density and Core Description. Grain density and lithologic descriptions
are often provided in data for routine core analysis. Grain density depends on
the lithology and composition of the reservoir of interest. Densities of some
common minerals found in reservoir rocks are listed in Table 5-22 [41].
Results oi Core Analyses from Various Reservoirs. Typical core analyses [23]
of different formations from various states and regions of the U.S. are listed in
Table 5-23a to 5-2%. In addition to ranges in permeability, porosity, oil satura-
tion, connate water saturation, the depth and thickness of the productive
intervals are given.
(tmt continued ma page 108)
Table 5-22
Densities of Common Minerals
In Reservoir Rocks
Matrix denslty'
Material (amlcmg)
Sand (consolidated) 2.65
Sand (unconsolidated) 2.65
Limestone 2.71
Dolomite 2.8-2.9
Shale 1.8-2.7
Gypsum 2.32
Anhydrite 2.9-3.0
Halite 2.16
_ _ _ _ ~
From Reference 41.
These figures are averages and may vary from area to
area, depending on types and abundance of secondary
minerals.