
Page 107 - Standard Handbook Petroleum Natural Gas Engineering VOLUME2
P. 107
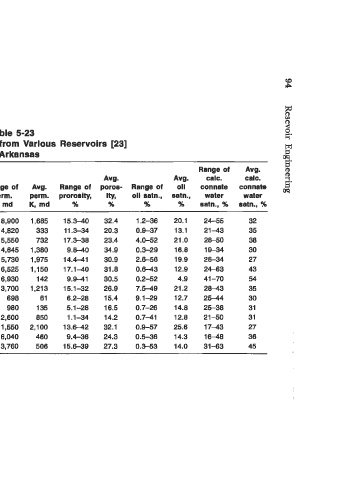
Table 5-23
 Typical Core Analyses from Various Reservoirs [23]   M
                                                   3
 (a) Arkansas                                      8.
                                                   s
 Range of   Avg.                    Range of   Avg.   CD
 Avg.   prod.   prod.   Avg.    Avg.   calc.   celc.   q
                                                   w.
 Range of   prod.   thlck-   thlck-   Range of   Avg.   Range of   poros-  Range of   all   connate   connate  3
 Fluid   prod.   depth,   ness,   ness,   perm.   perm.  prorosity,   Ity,   oll satn.,   satn.,   water   water
 Formatlon   prod.   depth, ft   ft   ft   ft   K,  md   K,  md   %   %   %   %   satn.,  %   satn.,  %
                         ~   ~~~~           ~
               ~~   ~
 Blossom   C/O'   2,190-2,655   2,422   3-28   15   1.6-  8,900   1,685   15.3-40   32.4   1.2-36   20.1   24-55   32
 Cotton Vally   c/o   5,5304,020   6,774   4-79   20   0.6-  4,820   333   11.3-34   20.3   0.9-37   13.1   21-43   35
 Glen Rose+   0   2,4704,835   3,052   5-15   10   1.6-  5,550   732   17.3-38   23.4   4.042   21  .o   28-50   38
 Graves   c/o   2,400-2.725   2,564   2-26   11   1.2-  4,645   1,380   9.840   34.9   0.3-29   16.8   19-34   30
 How   0   3,1459,245   3,195   12-33   17   6.5-  5,730   1,975   14.4-41   30.9   2.6-56   19.9   26-34   27
 Meakin   GICIO'  2,270-2,605   2,485   2-20   11   3.0-  6,525   1,150   17.1-40   31.8   0.6-43   12.9   24-63   43
 Nacatoch   CIO   1,610-2,392   2,000   6-45   20   0.7-  6,930   1 42   9.941   30.5   0.2-52   4.9   41-70   54
 Paluxy   0   2,8504,890   3,868   6-17   12   5-13,700   1,213   15.1-32   26.9   7.549   21.2   28-43   35
 Pettit   0   4,0104,855   4,933   4-19   11   0.1-   698   61   6.2-28   15.4   9.1-29   12.7   25-44   30
 Rodessa*   0   5,9904,120   6,050   8-52   16   0.1-   980   135   5.1-28   16.5   0.7-26   14.8   25-38   31
 SmackoverP   GICIO  6,340-9.330   8,260   2-74   18   0.1-1  2,600   850   1.1-34   14.2   0.7-41   12.8   21-50   31
 Tokio   c/o   2,324-2,955   2,640   2-19   13   0.5-1  1,550   2,100   13.6-42   32.1   0.9-57   25.6   1743   27
 Travis  Peak   c/o   2,6956,185   3,275   3-25   10   0.4-  6,040   460   9.4-36   24.3   0.5-36   14.3   16-48   36
 Tuscaloosa   c/o   3,020-3,140   3,080   4-25   15   0.4-  3,760   506   15.6-39   27.3   0.3-53   14.0   31-63   45
 From Reference 23.
 " Indicates fluid produced: G-gas;  C-condensate; O-oil.
 t Specific zone not indentified locally.
 * Includes data from  Mitchell and Gloyd zones.
 Includes data from  Smackover Lime and  Reynolds zones.