
Page 113 - Standard Handbook Petroleum Natural Gas Engineering VOLUME2
P. 113
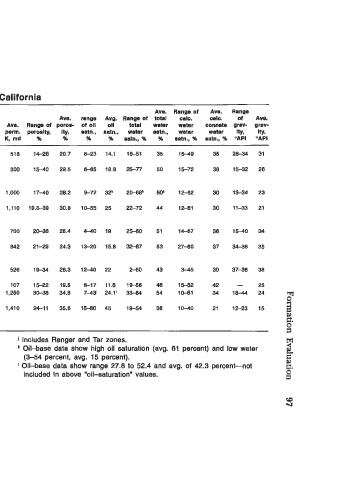
(d) California
 Range of   Avs.            Ave.  Range of   Ave.   Range
 Ave.   prod.   prod.   Ave.   range   Avg.  Range d  total   calc.   calc.   of   Ave.
 Range of   prod.   thick-   thlck-  Range of   Ave.   Range d  poros-  ot 011   oll   total   water   water   connate  grav-   grav-
 !%Id   prod.   depth,   ne=,   ness,   perm.   perm.  porostty,   Ity,   aatn.,   satn.,   water   sstn.,   water   water   Hy,   Ity,
 Formatlon   Ana   prod.   dapth, R   fi   n   R   K,  md   K,  md   %   %   %   %   satn..  %   %   satn.,  %  aatn.,  %  "API   "API
 Eocene, Lower   San Joaquin   0   8,8204,263   7,940   -   -   35-2,000   518   14-26   20.7   8-23   14.1   16-51   35   15-49   35   26-34   31
 Valley'
 Mlocene   Los Angeles   0   2,870-9,530   5,300   60-  450   165   104,000   300   15-40   28.5   6-65   18.8   25-77   50   15-72   36   15-32   26
 Basin and
 Coastal3
 Miocene, Upper  San Joaquin   0   1,940-7,340   4,210   10-1,200   245   4-7,500   1,000   17-40   28.2   9-72   3Z1   20-6Ek   50k   12-62   30   13-34   23
 Vallep
 Los Angeles   0   2,5204,860   4,100   5-1.040   130   86-5.MO   1,110   19.5-39   30.8   10-55   25   22-72   44   12-61   30   11-33   21
 Basin and
 Coastalo
 Mlocene, Lower  San Joaquin   0   2,770-7,590   5,300   30-  154   76   154,000   700   2048   28.4   4-40   19   2-0   51   14-67   36   1540   34
 Valley'
 Los Angeles   0   3,6046,610   4,430   20-  380  134   2551.460   842   21-29   24.3   13-20   15.8   32-67   53   27-60   37   34-36   35
 Bash and
 Coastal'   -
 Oligocene   San Joaquin   0   4.589-4,717   4,639   -   10-2.000   526   19-34   26.3   12-40   22   2-60   43   3-45   30   3748   38
 Vallep
 COastaP   0   5,8364,170   6,090   -   -   20-  400   107   15-22   19.5   6-17   11.8   19-56   46   15-52   42   -   25
 Pliocene   San Joaquin   0   2,4564,372   2,730   5-  80   33  27B-9.400  1,250   3046   34.8   7-43'   24.1'   39-84   54   10-61   34   1&44   24   9
 Valley'                                            8
 Los Angeles   0   2,0504,450   2,680   -   100   25-4.500  1.41  0   24-11   35.6   15-80   45   19-54   36   1040   21   12-23   15   8
 Basin and                                          P,
 Coastall
 Mainly data from Gatchell zone.   I  Includes Ranger and Tar  zones.   m
 Includes Upper and Lower Terminal,  Union Pacific, Ford, "237,"   Oil-base  data show  high oil saturation (avg.  61 percent) and low water   !3
 and Sesnon zones.   (3-54  percent, avg.  15 percent).
                                                    i?
 E   Includes Kernco, Republic, and '26  R" zones.   i Oil-base  data show range 27.6  to 52.4  and avg.  of  42.3  percent-not   pl
 d  Includes Jones and Main zones.   included in above "oil-saturation"  values.   s
 e  Includes "JV,"  Oicese,  and Phacoides zones.
 Mainly data from Vaqueros zone.
 g  Mainly data from Oceanic zone.                  (0
                                                    4
 Mainly data from Sespe zone.
 i Includes Sub Mulinia and Sub Scalez No.  1 and No. 2  zones.