
Page 134 - Standard Handbook Petroleum Natural Gas Engineering VOLUME2
P. 134
108 Reservoir Engineering
(kt continuedfmm page 93)
Special Core Analysls Tests. Special core analysis testing is done when
specifically required. Visual inspection and some petrographic studies are
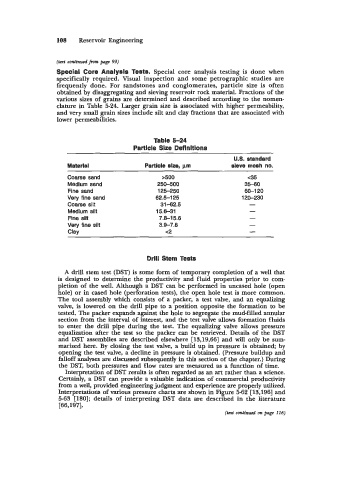
frequently done. For sandstones and conglomerates, particle size is often
obtained by disaggregating and sieving reservoir rock material. Fractions of the
various sizes of grains are determined and described according to the nomen-
clature in Table 5-24. Larger grain size is associated with higher permeability,
and very small grain sizes include silt and clay fractions that are associated with
lower permeabilities.
Table 5-24
Partlcle Slze Definltlons
U.S. standard
Material Particle size, pm sieve mesh no.
Coarse sand >500 c35
Medium sand 250-500 35-60
Fine sand 125-250 60-1 20
Very fine sand 62.5-125 120-230
Coarse silt 31-62.5 -
Medium silt 15.6-31 -
Fine silt 7.8-1 5.6 -
Very fine silt 3.9-7.8 -
Clay c2 -
Drill Stem Tests
A drill stem test (DST) is some form of temporary completion of a well that
is designed to determine the productivity and fluid properties prior to com-
pletion of the well. Although a DST can be performed in uncased hole (open
hole) or in cased hole (perforation tests), the open hole test is more common.
The tool assembly which consists of a packer, a test valve, and an equalizing
valve, is lowered on the drill pipe to a position opposite the formation to be
tested. The packer expands against the hole to segregate the mud-filled annular
section from the interval of interest, and the test valve allows formation fluids
to enter the drill pipe during the test. The equalizing valve allows pressure
equalization after the test so the packer can be retrieved. Details of the DST
and DST assemblies are described elsewhere [13,19,66] and will only be sum-
marized here. By closing the test valve, a build up in pressure is obtained; by
opening the test valve, a decline in pressure is obtained. (Pressure buildup and
falloff analyses are discussed subsequently in this section of the chapter.) During
the DST, both pressures and flow rates are measured as a function of time.
Interpretation of DST results is often regarded as an art rather than a science.
Certainly, a DST can provide a valuable indication of commercial productivity
from a well, provided engineering judgment and experience are properly utilized.
Interpretations of various pressure charts are shown in Figure 5-62 [13,196] and
5-63 [180]; details of interpreting DST data are described in the literature
[66,197].
(text continued on page 116)