
Page 15 - Standard Handbook Petroleum Natural Gas Engineering VOLUME2
P. 15
4 Reservoir Engineering
practices tending to conserve the reservoir pressure and retard the evolution
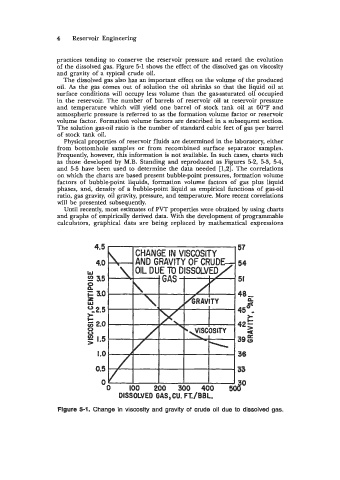
of the dissolved gas. Figure 5-1 shows the effect of the dissolved gas on viscosity
and gravity of a typical crude oil.
The dissolved gas also has an important effect on the volume of the produced
oil. As the gas comes out of solution the oil shrinks so that the liquid oil at
surface conditions will occupy less volume than the gas-saturated oil occupied
in the reservoir. The number of barrels of reservoir oil at reservoir pressure
and temperature which will yield one barrel of stock tank oil at 60°F and
atmospheric pressure is referred to as the formation volume factor or reservoir
volume factor. Formation volume factors are described in a subsequent section.
The solution gas-oil ratio is the number of standard cubic feet of gas per barrel
of stock tank oil.
Physical properties of reservoir fluids are determined in the laboratory, either
from bottomhole samples or from recombined surface separator samples.
Frequently, however, this information is not available. In such cases, charts such
as those developed by M.B. Standing and reproduced as Figures 5-2, 5-3, 54,
and 5-5 have been used to determine the data needed [1,2]. The correlations
on which the charts are based present bubble-point pressures, formation volume
factors of bubble-point liquids, formation volume factors of gas plus liquid
phases, and, density of a bubble-point liquid as empirical functions of gas-oil
ratio, gas gravity, oil gravity, pressure, and temperature. More recent correlations
will be presented subsequently.
Until recently, most estimates of PVT properties were obtained by using charts
and graphs of empirically derived data. With the development of programmable
calculators, graphical data are being replaced by mathematical expressions
57
54
51
48 E
45 -
04
s
I-
42 3
U
39 E
36
33
Figure 5-1. Change in viscosity and gravity of crude oil due to dissolved gas.