
Page 166 - Standard Handbook Petroleum Natural Gas Engineering VOLUME2
P. 166
Formation Evaluation 135
A sheet of current measuring one to two feet thick is then forced into the
formation from A,,. The potential is then measured between M and M, and a
surface ground. Since Io is a constant, any variation in M, and M, current is
proportional to formation resistivity. Figure 5-75c shows the electrode arrange-
ment [58].
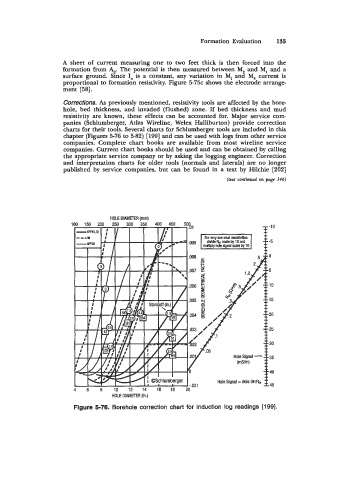
Corrections. As previously mentioned, resistivity tools are affected by the bore-
hole, bed thickness, and invaded (flushed) zone. If bed thickness and mud
resistivity are known, these effects can be accounted for. Major service com-
panies (Schlumberger, Atlas Wireline, Welex Halliburton) provide correction
charts for their tools. Several charts for Schlumberger tools are included in this
chapter (Figures 5-76 to 5-82) [199] and can be used with logs from other service
companies. Complete chart books are available from most wireline service
companies. Current chart books should be used and can be obtained by calling
the appropriate service company or by asking the logging engineer. Correction
and interpretation charts for older tools (normals and laterals) are no longer
published by service companies, but can be found in a text by Hilchie [202]
(text continued OR page 146)
HOLE DIAMETER (mm)
HOLE DIAM€I€R (in.)
Figure 5-76. Borehole correction chart for induction log readings [199].