
Page 188 - Standard Handbook Petroleum Natural Gas Engineering VOLUME2
P. 188
Formation Evaluation 157
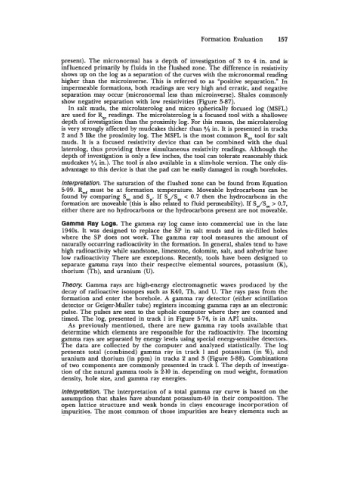
present). The micronormal has a depth of investigation of 3 to 4 in. and is
influenced primarily by fluids in the flushed zone. The difference in resistivity
shows up on the log as a separation of the curves with the micronormal reading
higher than the microinverse. This is referred to as "positive separation." In
impermeable formations, both readings are very high and erratic, and negative
separation may occur (micronormal less than microinverse). Shales commonly
show negative separation with low resistivities (Figure 5-87).
In salt muds, the microlaterolog and micro spherically focused log (MSFL)
are used for R, readings. The microlaterolog is a focused tool with a shallower
depth of investigation than the proximity log. For this reason, the microlaterolog
is very strongly affected by mudcakes thicker than J/8 in. It is presented in tracks
2 and 3 like the proximity log. The MSFL is the most common R., tool for salt
muds. It is a focused resistivity device that can be combined with the dual
laterolog, thus providing three simultaneous resistivity readings, Although the
depth of investigation is only a few inches, the tool can tolerate reasonably thick
mudcakes 5h in.). The tool is also available in a slim-hole version. The only dis-
advantage to this device is that the pad can be easily damaged in rough boreholes.
Interpretation. The saturation of the flushed zone can be found from Equation
5-99. Rm, must be at formation temperature. Moveable hydrocarbons can be
found by comparing Sm and Sw. If Sw/Sm c 0.7 then the hydrocarbons in the
formation are moveable (this is also related to fluid permeability). If SJSm > 0.7,
either there are no hydrocarbons or the hydrocarbons present are not moveable.
Gamma Ray Logs. The gamma ray log came into commercial use in the late
1940s. It was designed to replace the SP in salt muds and in air-filled holes
where the SP does not work. The gamma ray tool measures the amount of
naturally occurring radioactivity in the formation. In general, shales tend to have
high radioactivity while sandstone, limestone, dolomite, salt, and anhydrite have
low radioactivity There are exceptions. Recently, tools have been designed to
separate gamma rays into their respective elemental sources, potassium (K),
thorium (Th), and uranium (U).
Theory. Gamma rays are high-energy electromagnetic waves produced by the
decay of radioactive isotopes such as K40, Th, and U. The rays pass from the
formation and enter the borehole. A gamma ray detector (either scintillation
detector or Geiger-Muller tube) registers incoming gamma rays as an electronic
pulse. The pulses are sent to the uphole computer where they are counted and
timed. The log, presented in track 1 in Figure 5-74, is in API units.
As previoiisly mentioned, there are new gamma ray tools available that
determine which elements are responsible for the radioactivity. The incoming
gamma rays are separated by energy levels using special energy-sensitive detectors.
The data are collected by the computer and analyzed statistically. The log
presents total (combined) gamma ray in track 1 and potassium (in %), and
uranium and thorium (in ppm) in tracks 2 and 5 (Figure 5-88). Combinations
of two components are commonly presented in track 1. The depth of investiga-
tion of the natural gamma tools is 2-10 in. depending on mud weight, formation
density, hole size, and gamma ray energies.
Interpretation. The interpretation of a total gamma ray curve is based on the
assumption that shales have abundant potassium-40 in their composition. The
open lattice structure and weak bonds in clays encourage incorporation of
impurities. The most common of those impurities are heavy elements such as