
Page 192 - Standard Handbook Petroleum Natural Gas Engineering VOLUME2
P. 192
Formation Evaluation 161
Theow. The density tool emits medium energy gamma rays from a radioactive
chemical source (usually Cs-137). The gamma rays penetrate the formation and
collide with electron clouds in the minerals in the rock. With each collision
the gamma ray loses some energy until it reaches a lower energy state. This
phenomenon is called "Compton scattering." Some gamma rays are absorbed,
and a high-energy electron is emitted from the atom. This phenomenon is called
the "photoelectric absorption" effect, and is a function of the average atomic
weight of each element. Both the Compton-scattered gamma ray and the photo-
electrically produced electron return to the borehole where they are detected
by scintillation tubes on the density tool. The main result is that a porous
formation will have many returning gamma rays while a nonporous formation
will have few returning gamma rays. Each tool has two detectors; one is near
the source (short-spacing detector) and another is 1-1.5 ft (35-40 cm) away from
the near detector (long-spacing detector).
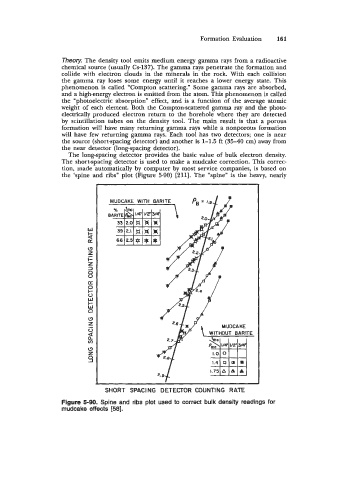
The long-spacing detector provides the basic value of bulk electron density.
The short-spacing detector is used to make a mudcake correction. This correc-
tion, made automatically by computer by most service companies, is based on
the 'spine and ribs" plot (Figure 5-90) [211]. The "spine" is the heavy, nearly
~~~~ ~
SHORT SPACING DETECTOR COUNTING RATE
Figure 5-90. Spine and ribs plot used to correct bulk density readings for
mudcake effects [58].