
Page 196 - Standard Handbook Petroleum Natural Gas Engineering VOLUME2
P. 196
Formation Evaluation 165
0 I I I I 1 I
2
4
6
Le
W
LL
z IO
a
v)
$ 12
I-
I
li 14
w
n
I6
18
2c
0. 0.2 0.3
I
GAS DENSITY, g/crn3
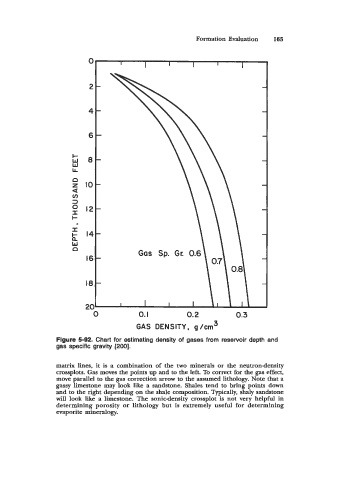
Figure 5-92. Chart for estimating density of gases from reservoir depth and
gas specific gravity [200].
matrix lines, it is a combination of the two minerals or the neutrondensity
crossplots. Gas moves the points up and to the left. To correct for the gas effect,
move parallel to the gas correction arrow to the assumed lithology. Note that a
gassy limestone may look like a sandstone. Shales tend to bring points down
and to the right depending on the shale composition. Typically, shaly sandstone
will look like a limestone. The sonicdensity crossplot is not very helpful in
determining porosity or lithology but is extremely useful for determining
evaporite mineralogy.