
Page 199 - Standard Handbook Petroleum Natural Gas Engineering VOLUME2
P. 199
168 Reservoir Engineering
1.9
45
2.0
40
2.1 35
h
9
.-
I'
2.2 30 h
u
h
s 25 2
.-
L
," 2.3 '1,
3 E
P) 20 Q
v
2.4 h
3
F
' 15 .-
n
rn !=
v)
r
iz 2.5 10 1
.z
2.6 rn
5 2
d
8
2.7 0
2.8 -5
-10
2.9
-1 5
3.0
0 10 20 30 40
@sN~~~~, Porosity Index (pu)
Neutron
(Apparent Limestone Porosity)
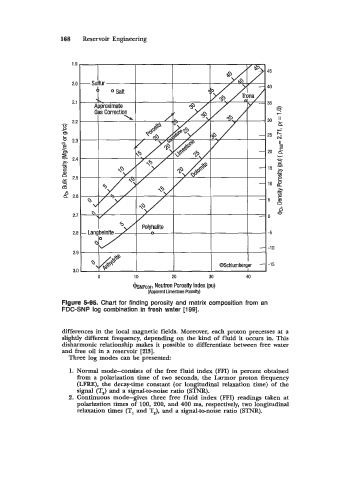
Figure 5-95. Chart for finding porosity and matrix composition from an
FDC-SNP log combination in fresh water [199].
differences in the local magnetic fields. Moreover, each proton precesses at a
slightly different frequency, depending on the kind of fluid it occurs in. This
disharmonic relationship makes it possible to differentiate between free water
and free oil in a reservoir [213].
Three log modes can be presented
1. Normal mode--consists of the free fluid index (FFI) in percent obtained
from a polarization time of two seconds, the Larmor proton frequency
(LFRE), the decay-time constant (or longitudinal relaxation time) of the
signal (T,) and a signal-to-noise ratio (STNR).
2. Continuous mode-gives three free fluid index (FFI) readings taken at
polarization times of 100, 200, and 400 ms, respectively, two longitudinal
relaxation times (T, and T,), and a signal-to-noise ratio (STNR).