
Page 198 - Standard Handbook Petroleum Natural Gas Engineering VOLUME2
P. 198
Formation Evaluation 167
0 10 20 30 40
Apparent
$sN~~~~~ Limestone Neutron Porosity (pu)
$CN~,,~, Apparent Limestone Neutron Porosity (pu)
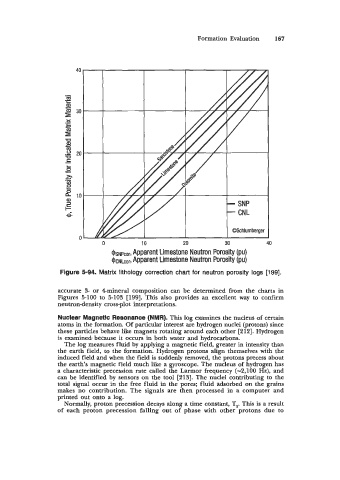
Figure 5-94. Matrix lithology correction chart for neutron porosity logs [199].
accurate 3- or 4-mineral composition can be determined from the charts in
Figures 5-100 to 5-103 [199]. This also provides an excellent way to confirm
neutron-density cross-plot interpretations.
Nuclear Magnetic Resonance (NMR). This log examines the nucleus of certain
atoms in the formation. Of particular interest are hydrogen nuclei (protons) since
these particles behave like magnets rotating around each other [212]. Hydrogen
is examined because it occurs in both water and hydrocarbons.
The log measures fluid by applying a magnetic field, greater in intensity than
the earth field, to the formation. Hydrogen protons align themselves with the
induced field and when the field is suddenly removed, the protons precess about
the earth’s magnetic field much like a gyroscope. The nucleus of hydrogen has
a characteristic precession rate called the Larmor frequency (-2,100 Hz), and
can be identified by sensors on the tool [213]. The nuclei contributing to the
total signal occur in the free fluid in the pores; fluid adsorbed on the grains
makes no contribution. The signals are then processed in a computer and
printed out onto a log.
Normally, proton precession decays along a time constant, T2. This is a result
of each proton precession falling out of phase with other protons due to