
Page 195 - Standard Handbook Petroleum Natural Gas Engineering VOLUME2
P. 195
164 Reservoir Engineering
TEMPERATURE, C
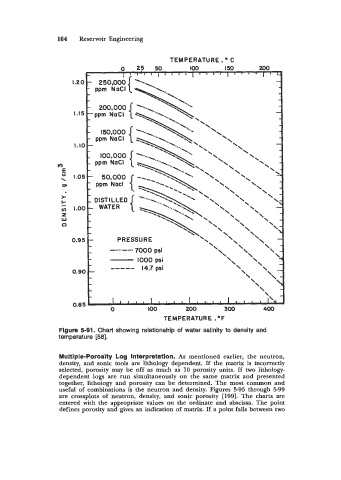
Figure 5-91. Chart showing relationahip of water salinity to density and
temperature [58].
Multiple-Porosity Log Interpretation. As mentioned earlier, the neutron,
density, and sonic tools are lithology dependent. If the matrix is incorrectly
selected, porosity may be off as much as 10 porosity units. If two lithology-
dependent logs are run simultaneously on the same matrix and presented
together, lithology and porosity can be determined. The most common and
useful of combinations is the neutron and density. Figures 5-95 through 5-99
are crossplots of neutron, density, and sonic porosity [199]. The charts are
entered with the appropriate values on the ordinate and abscissa. The point
defines porosity and gives an indication of matrix. If a point falls between two