
Page 197 - Standard Handbook Petroleum Natural Gas Engineering VOLUME2
P. 197
166 Reservoir Engineering
I
GAMMARAY
MICROGRAMS RA-EQRON
I I V . To M
o*MMA RAY U
OF mis UNE
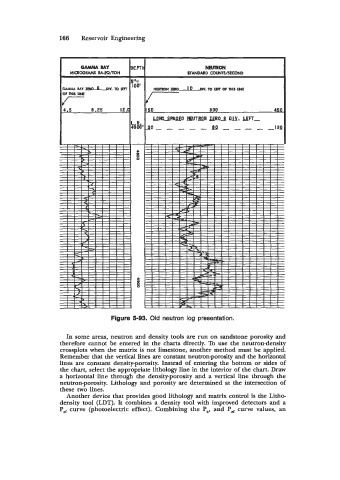
Figure 5-93. Old neutron log presentation.
In some areas, neutron and density tools are run on sandstone porosity and
therefore cannot be entered in the charts directly. To use the neutron-density
crossplots when the matrix is not limestone, another method must be applied.
Remember that the vertical lines are constant neutron-porosity and the horizontal
lines are constant density-porosity. Instead of entering the bottom or sides of
the chart, select the appropriate lithology line in the interior of the chart. Draw
a horizontal line through the density-porosity and a vertical line through the
neutron-porosity. Lithology and porosity are determined at the intersection of
these two lines.
Another device that provides good lithology and matrix control is the Litho-
density tool (LDT). It combines a density tool with improved detectors and a
Pe, curve (photoelectric effect). Combining the Pb, and Pe, curve values, an