
Page 194 - Standard Handbook Petroleum Natural Gas Engineering VOLUME2
P. 194
Formation Evaluation 163
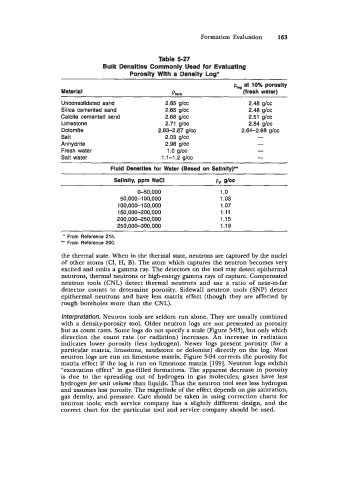
Table 5-27
Bulk Densities Commonly Used for Evaluating
Porosity With a Density Log*
p,, at 10% porosity
Material Pbvlk (fresh water)
Unconsolidated sand 2.65 glcc 2.48 glcc
Silica cemented sand 2.65 glcc 2.48 glcc
Calcite cemented sand 2.68 glcc 2.51 glcc
Limestone 2.71 glcc 2.54 glcc
Dolomite 2.a3-2.87 gicc 2.64-2.68 glcc
-
Salt 2.03 glcc
Anhydrite 2.98 glcc -
Fresh water 1.0 glcc -
Salt water 1.1-1.2 glcc -
Fluid Densities for Water (Based on Salinity)”*
Salinity, ppm NaCl Pr glee
0-50,000 1 .o
50,000-1 00,000 1.03
100,000-1 50,000 1.07
150,000-200,000 1.11
200,000-250,000 1.15
250,00&300,000 1.19
’ From Reference 215.
** From Reference 200.
the thermal state. When in the thermal state, neutrons are captured by the nuclei
of other atoms (Cl, H, B). The atom which captures the neutron becomes very
excited and emits a gamma ray. The detectors on the tool may detect epithermal
neutrons, thermal neutrons or high-energy gamma rays of capture. Compensated
neutron tools (CNL) detect thermal neutrons and use a ratio of near-to-far
detector counts to determine porosity. Sidewall neutron tools (SNP) detect
epithermal neutrons and have less matrix effect (though they are affected by
rough boreholes more than the CNL).
Interpretation. Neutron tools are seldom run alone. They are usually combined
with a density-porosity tool. Older neutron logs are not presented as porosity
but as count rates. Some logs do not specify a scale (Figure 5-93), but only which
direction the count rate (or radiation) increases. An increase in radiation
indicates lower porosity (less hydrogen). Newer logs present porosity (for a
particular matrix, limestone, sandstone or dolomite) directly on the log. Most
neutron logs are run on limestone matrix. Figure 5-94 corrects the porosity for
matrix effect if the log is run on limestone matrix [199]. Neutron logs exhibit
“excavation effect” in gas-filled formations. The apparent decrease in porosity
is due to the spreading out of hydrogen in gas molecules; gases have less
hydrogen per unit volume than liquids. Thus the neutron tool sees less hydrogen
and assumes less porosity. The magnitude of the effect depends on gas saturation,
gas density, and pressure. Care should be taken in using correction charts for
neutron tools; each service company has a slightly different design, and the
correct chart for the particular tool and service company should be used.