Page 204 - Standard Handbook Petroleum Natural Gas Engineering VOLUME2
P. 204

Formation Evaluation   173


                                    tmm, Apparent Matrix Density (ps/ft)
                        1 30  120   110   100   90   80   70   60   50   40   31 0
                        3                                                      130


                       2.9                                                     120

                       2.8                                                     110
                                                                               100  5
                                                                                  h
                                                                                   =L
                                                                                  u
                                                                               90   F
                                                                                   w  .-
                                                                               80  E
                   s
                       2.4
                    d
                   Q
                       2.3


                       2.2                                                     50

                       2.1                                                     40

                        2                                                      30
                         3   2.9   2.8  2.7  2.6   2.5   2.4   2.3   2.2   2.1   2
                                     Pmm, Apparent Matrix Density (g/cc)

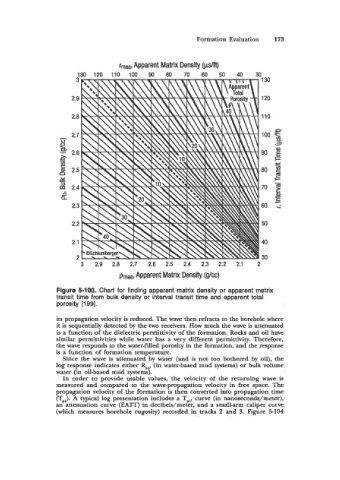
                  Figure 5-100.  Chart for finding apparent matrix density or  apparent matrix
                  transit time from  bulk density or  interval transit  time and apparent total
                  porosity [199].
                  its propagation velocity is reduced. The wave then refracts to the borehole where
                  it is sequentially detected by  the two receivers. Haw much the wave is attenuated
                  is a function of the dielectric permittivity of the formation. Rocks and oil have
                  similar permittivities while water  has  a very  different permittivity. Therefore,
                  the wave responds to the water-filled porosity in the formation, and the response
                  is a function of  formation temperature.
                    Since the wave  is  attenuated by  water  (and is  not  too bothered by  oil), the
                  log response indicates either L, (in water-based mud systems) or bulk volume
                  water (in oil-based mud systems).
                    In  order  to  provide  usable values,  the  velocity  of  the  returning  wave  is
                  measured and  compared to  the  wave-propagation velocity in  free  space. The
                  propagation velocity of  the formation is then converted into propagation time
                  (Tp,).  A  typical log presentation includes a Tpl, curve (in nanoseconds/meter),
                  an attenuation curve (EATT) in decibels/meter,  and a small-arm caliper curve
                  (which measures borehole rugosity) recorded in  tracks 2  and 3.  Figure 5-104
   199   200   201   202   203   204   205   206   207   208   209