
Page 206 - Standard Handbook Petroleum Natural Gas Engineering VOLUME2
P. 206
Formation Evaluation 175
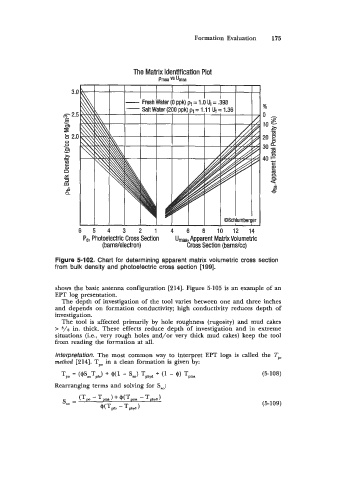
The Matrix Identification Plot
Pmaa vs Umaa
%
6 5 4 3 2 1 4 6 8 10 12 14
Pel Photoelectric Cross Section Umm, Apparent Matrix Volumetric
(barns/electron) Cross Section (barnskc)
Figure 5-102. Chart for determining apparent matrix volumetric cross section
from bulk density and photoelectric cross section [199].
shows the basic antenna configuration [214]. Figure 5-105 is an example of an
EFT log presentation.
The depth of investigation of the tool varies between one and three inches
and depends on formation conductivity; high conductivity reduces depth of
investigation.
The tool is affected primarily by hole roughness (rugosity) and mud cakes
> s/s in. thick. These effects reduce depth of investigation and in extreme
situations (i.e., very rough holes and/or very thick mud cakes) keep the tool
from reading the formation at all.
Interpretation. The most common way to interpret EPT logs is called the Tpo
method [214]. Tpo in a clean formation is given by:
Tpo ($sxoTpfo) + $(' - 'm) Tph@ + - $1 Tpma (5-108)
Rearranging terms and solving for Sxo:
(5-1 09)