
Page 257 - Standard Handbook Petroleum Natural Gas Engineering VOLUME2
P. 257
226 Reservoir Engineering
reservoir energy varies with producing mechanisms that are broadly classified
as: solution-gas or depletion drive, gas cap drive, natural water drive, gravity
drainage, and compaction drive. In some reservoirs, production can be attributed
mainly to one of the mechanisms; in other cases, production may result from
more than one mechanism, and this is referred to as a combination drive.
Statistical Analysis of Primary Oil Recovery
Most of the producing mechanisms are sensitive to the rate of oil production;
only the solution gas drive mechanism is truly rate-insensitive [ 1801. Primary
recoveries are usually reported [180] to be less than 25% of the original oil in
place by solution gas drive, 30% to 50% of OOIP for water drive, and can exceed
75% of OOIP for gravity drainage in thick reservoirs with high vertical per-
meabilities. For water drive reservoirs, primary recovery efficiency can be low
if the initial water saturation is more than 5096, if permeability is low, or if the
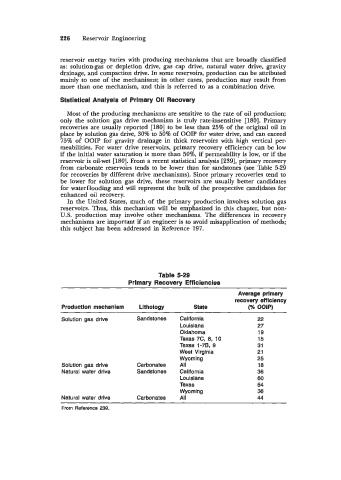
reservoir is oil-wet [180]. From a recent statistical analysis [239], primary recovery
from carbonate reservoirs tends to be lower than for sandstones (see Table 5-29
for recoveries by different drive mechanisms). Since primary recoveries tend to
be lower for solution gas drive, these reservoirs are usually better candidates
for waterflooding and will represent the bulk of the prospective candidates for
enhanced oil recovery.
In the United States, much of the primary production involves solution gas
reservoirs. Thus, this mechanism will be emphasized in this chapter, but non-
U.S. production may involve other mechanisms. The differences in recovery
mechanisms are important if an engineer is to avoid misapplication of methods;
this subject has been addressed in Reference 197.
Table 5-29
Prlmary Recovery Efficiencies
Average prlmnry
recovery efflciency
Productlon mechanism Lithology State (% OOIP)
Solution gas drive Sandstones California 22
Louisiana 27
Oklahoma 19
Texas 7C, 8, 10 15
9
Texas 1-7B, 31
West Virginia 21
Wyoming 25
Solution gas drive Carbonates All 18
Natural water drive Sandstones California 36
Louisiana 60
Texas 54
Wyoming 36
Natural water drive Carbonates All 44
From Reference 239.