Page 458 - Standard Handbook Petroleum Natural Gas Engineering VOLUME2
P. 458
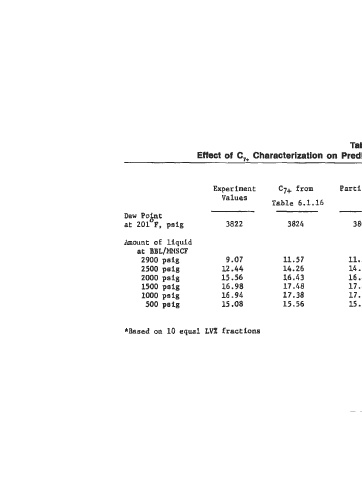
Table 6-18
                                    Effect of  C,  Characterization on Predlcted Sample Problem Phase Behavior [12]
                                                                            C7+  Predicted  Values  far characterization
                                                                               Chromatographic
                                       Experiment   Cl4  from   Partial TBP   Fractions  as   Fractions  from   Lumped   C7+  as
                                                   ..
                                        Values                           n-paraffins                       nc1o
                                                 Table  6.1.16                      ASTM  dest.  curve   c7'
                       Dew  Podnt
                       at 201 F, psig    3822       3824       3800         3583         3553      3150    2877
                                                                                                                  7
                       Amount  of liquid
                         at  BBL/>MSCF
                          2900  psig     9.07      11.57       11.50       11.07         7.37      5.95    0.0
                          2500  psig    12.44      14.26       14.22       14.89        10.21      12.40   14.09
                                                                                                          18.77
                          2000  psig    15.56      16.43       16.44       17.77        12.66      17.09   21.74  '
                          1500 psig     16.98      17.48       17.49       19.08        14.00      19.35          3
                          1000 psig     16.94      17.38       17.39       18.99        14.15      19.91   22.25
                           500  psig    15 .OS     15.56       15.59       16.98        12.46      18.11   20.32   %
                                                                                                                  n
                       *Based  on  10 equal  LV% fractions                                                        %
                                                                                                                  8
                                                                                                                  E
                                                                                                                  z
                                                                                                                  E'
                                                                                                                  8
                                                                                                                  e
                                                                                                                  4

