
Page 97 - Standard Handbook Petroleum Natural Gas Engineering VOLUME2
P. 97
Basic Principles, Definitions, and Data 85
tortuous path lengths. These variations affect resistivity, which results in different
resistivity-saturation relationships such as were presented for carbonate cores by
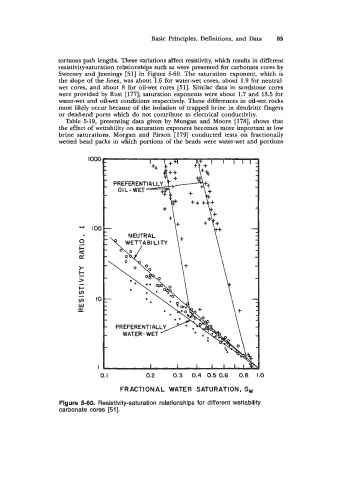
Sweeney and Jennings [51] in Figure 5-60. The saturation exponent, which is
the slope of the lines, was about 1.6 for water-wet cores, about 1.9 for neutral-
wet cores, and about 8 for oil-wet cores [51]. Similar data in sandstone cores
were provided by Rust [17'7]; saturation exponents were about 1.7 and 13.5 for
water-wet and oil-wet conditions respectively. These differences in oil-wet. rocks
most likely occur because of the isolation of trapped brine in dendritic fingers
or dead-end pores which do not contribute to electrical conductivity.
Table 5-19, presenting data given by Mungan and Moore [178], shows that
1
the effect of wettability on saturation exponent becomes more important at low
brine saturations. Morgan and Pirson [ 1791 conducted tests on fractionally
wetted bead packs in which portions of the beads were water-wet and portions
+
NEUTRAL ++
0. 0.2 0.3 0.4 0.5 0.6 0.8 1.0
I
FRACTIONAL WATER SATURATION, Sw
Figure 5-60. Resistivity-saturation relationships for different wettability
carbonate cores [51].