
Page 123 - Statistics II for Dummies
P. 123
Chapter 6: How Can I Miss You If You Won’t Leave? Regression Model Selection
Matrix Plot of Distance, Hang, R_Strength, L_Strength . . . 107
3 4 5 120 150 180 80 90 100
200
150 Distance
100 5
Hang 4
180 3
150 R_Strength
120
Figure 6-1: 180
A matrix of L_Strength 150
all scatter- 110 120
plots 100 R_Flexibility
between 90
pairs of 100
L_Flexibility 90
variables in
80
the punting 250
200 O_Strength
distance
150
example.
100 150 200 120 150 180 90 100 110 150 200 250
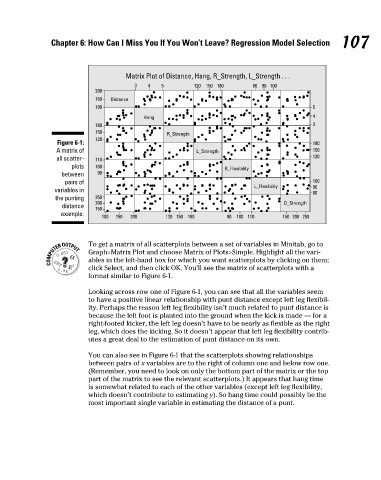
To get a matrix of all scatterplots between a set of variables in Minitab, go to
Graph>Matrix Plot and choose Matrix of Plots>Simple. Highlight all the vari-
ables in the left-hand box for which you want scatterplots by clicking on them;
click Select, and then click OK. You’ll see the matrix of scatterplots with a
format similar to Figure 6-1.
Looking across row one of Figure 6-1, you can see that all the variables seem
to have a positive linear relationship with punt distance except left leg flexibil-
ity. Perhaps the reason left leg flexibility isn’t much related to punt distance is
because the left foot is planted into the ground when the kick is made — for a
right-footed kicker, the left leg doesn’t have to be nearly as flexible as the right
leg, which does the kicking. So it doesn’t appear that left leg flexibility contrib-
utes a great deal to the estimation of punt distance on its own.
You can also see in Figure 6-1 that the scatterplots showing relationships
between pairs of x variables are to the right of column one and below row one.
(Remember, you need to look on only the bottom part of the matrix or the top
part of the matrix to see the relevant scatterplots.) It appears that hang time
is somewhat related to each of the other variables (except left leg flexibility,
which doesn’t contribute to estimating y). So hang time could possibly be the
most important single variable in estimating the distance of a punt.
7/23/09 9:27:03 PM
11_466469-ch06.indd 107 7/23/09 9:27:03 PM
11_466469-ch06.indd 107