
Page 124 - Statistics II for Dummies
P. 124
108
Part II: Using Different Types of Regression to Make Predictions
Looking for connections by using correlations
Scatterplots can give you some general ideas as to whether two variables
are related in a linear way. However, pinpointing that relationship requires a
numerical value to tell you how strongly the variables are related (in a linear
fashion) as well as the direction of that relationship. That numerical value is
the correlation (also known as Pearson’s correlation; see Chapter 4). So the
next step toward trimming down the possible candidates for x variables is to
calculate the correlation between each x variable and y.
To get a set of all the correlations between any set of variables in your model
by using Minitab, go to Stat>Basic Statistics>Correlation. Then highlight all the
variables you want correlations for, and click Select. (To include the p-values
for each correlation, click the Display p-values box.) Then click OK. You’ll see
a listing of all the variables’ names across the top row and down the first
column. Intersect the row depicting the first variable with the column depict-
ing the second variable in order to find the correlation for that pair.
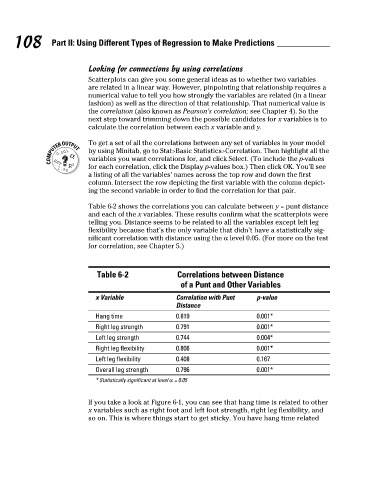
Table 6-2 shows the correlations you can calculate between y = punt distance
and each of the x variables. These results confirm what the scatterplots were
telling you. Distance seems to be related to all the variables except left leg
flexibility because that’s the only variable that didn’t have a statistically sig-
nificant correlation with distance using the α level 0.05. (For more on the test
for correlation, see Chapter 5.)
Table 6-2 Correlations between Distance
of a Punt and Other Variables
x Variable Correlation with Punt p-value
Distance
Hang time 0.819 0.001*
Right leg strength 0.791 0.001*
Left leg strength 0.744 0.004*
Right leg flexibility 0.806 0.001*
Left leg flexibility 0.408 0.167
Overall leg strength 0.796 0.001*
* Statistically significant at level α = 0.05
If you take a look at Figure 6-1, you can see that hang time is related to other
x variables such as right foot and left foot strength, right leg flexibility, and
so on. This is where things start to get sticky. You have hang time related
7/23/09 9:27:04 PM
11_466469-ch06.indd 108
11_466469-ch06.indd 108 7/23/09 9:27:04 PM