
Page 220 - Statistics II for Dummies
P. 220
204 Part III: Analyzing Variance with ANOVA
Your next question may be: Okay, which combination of detergent brand
and water temperature is best? To answer this question, I did multiple com-
parisons on the means from all 12 combinations. (To do this, I followed the
Minitab directions from the previous section.) Luckily, Tukey gives me an
overall error rate of only 5 percent, so doing this many tests doesn’t lead to
making a lot of incorrect conclusions.
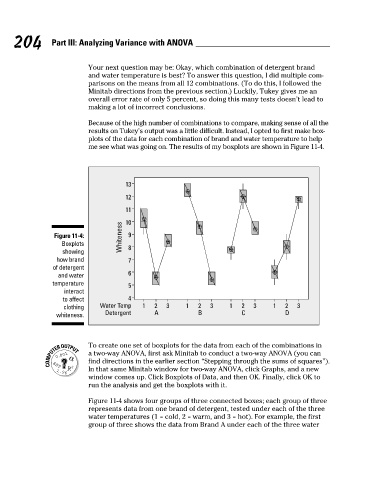
Because of the high number of combinations to compare, making sense of all the
results on Tukey’s output was a little difficult. Instead, I opted to first make box-
plots of the data for each combination of brand and water temperature to help
me see what was going on. The results of my boxplots are shown in Figure 11-4.
13
12
11
Whiteness
Figure 11-4: 10 9
Boxplots
showing 8
how brand 7
of detergent
6
and water
temperature 5
interact
to affect 4
clothing Water Temp 1 2 3 1 2 3 1 2 3 1 2 3
Detergent A B C D
whiteness.
To create one set of boxplots for the data from each of the combinations in
a two-way ANOVA, first ask Minitab to conduct a two-way ANOVA (you can
find directions in the earlier section “Stepping through the sums of squares”).
In that same Minitab window for two-way ANOVA, click Graphs, and a new
window comes up. Click Boxplots of Data, and then OK. Finally, click OK to
run the analysis and get the boxplots with it.
Figure 11-4 shows four groups of three connected boxes; each group of three
represents data from one brand of detergent, tested under each of the three
water temperatures (1 = cold, 2 = warm, and 3 = hot). For example, the first
group of three shows the data from Brand A under each of the three water
17_466469-ch11.indd 204 7/24/09 9:44:19 AM