
Page 225 - Statistics II for Dummies
P. 225
Chapter 12: Regression and ANOVA: Surprise Relatives! 209
Suppose you have a brainstorm that number of years of education could pos-
sibly be related to Internet use. In this case, the explanatory variable (input
variable, x) is years of education, and you want to use it to try to estimate
y, the number of hours spent on the Internet in a month. You ask a larger
random sample of 250 Internet users how many years of education they have
(so n = 250). You can check out the first ten observations from your data set
containing the (x, y) pairs in Table 12-1. If a significant connection of some
sort exists between the x-values and the y-values, then you can say that x is
helping to explain some of the variability in the y’s. If it explains enough vari-
ability, you can place x into a simple regression model and use it to estimate y.
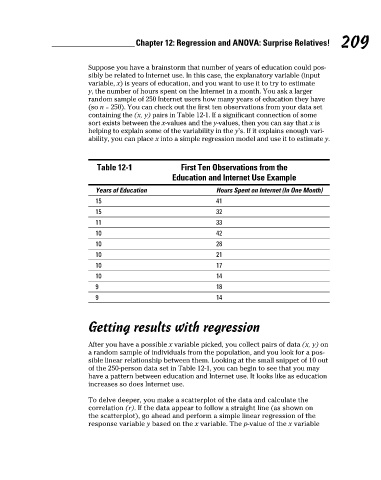
Table 12-1 First Ten Observations from the
Education and Internet Use Example
Years of Education Hours Spent on Internet (In One Month)
15 41
15 32
11 33
10 42
10 28
10 21
10 17
10 14
9 18
9 14
Getting results with regression
After you have a possible x variable picked, you collect pairs of data (x, y) on
a random sample of individuals from the population, and you look for a pos-
sible linear relationship between them. Looking at the small snippet of 10 out
of the 250-person data set in Table 12-1, you can begin to see that you may
have a pattern between education and Internet use. It looks like as education
increases so does Internet use.
To delve deeper, you make a scatterplot of the data and calculate the
correlation (r). If the data appear to follow a straight line (as shown on
the scatterplot), go ahead and perform a simple linear regression of the
response variable y based on the x variable. The p-value of the x variable
18_466469-ch12.indd 209 7/24/09 9:45:28 AM