
Page 226 - Statistics II for Dummies
P. 226
210 Part III: Analyzing Variance with ANOVA
in the simple linear regression analysis tells you whether or not the x vari-
able does a significant job in predicting y. (For the details on simple linear
regression, see Chapter 4.)
To do a simple linear regression using Minitab, enter your data in two col-
umns: the first column for your x variable and the second column for your y
variable (as in Table 12-1). Go to Stat>Regression>Regression. Click on your y
variable in the left-hand box; the y variable then appears in the Response box
on the right-hand side. Click on your x variable in the left-hand box; the x vari-
able then appears in the Predictor box in the right-hand side. Click OK, and
your regression analysis is done. As part of every regression analysis, Minitab
also provides you with the corresponding ANOVA results, found at the bottom
of the output.
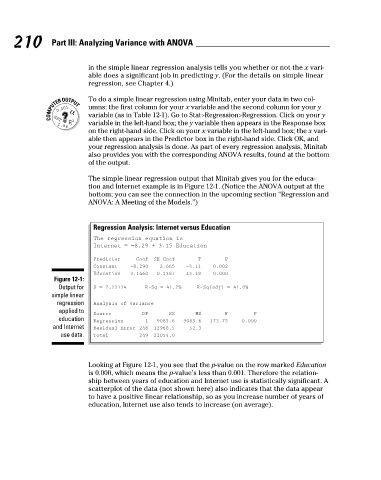
The simple linear regression output that Minitab gives you for the educa-
tion and Internet example is in Figure 12-1. (Notice the ANOVA output at the
bottom; you can see the connection in the upcoming section “Regression and
ANOVA: A Meeting of the Models.”)
Regression Analysis: Internet versus Education
The regression equation is
Internet = −8.29 + 3.15 Education
Predictor Coef SE Coef T P
Constant −8.290 2.665 −3.11 0.002
Education 3.1460 0.2387 13.18 0.000
Figure 12-1:
Output for S = 7.23134 R-Sq = 41.2% R-Sq(adj) = 41.0%
simple linear
regression Analysis of Variance
applied to
Source DF SS MS F P
education Regression 1 9085.6 9085.6 173.75 0.000
and Internet Residual Error 248 12968.5 52.3
use data. Total 249 22054.0
Looking at Figure 12-1, you see that the p-value on the row marked Education
is 0.000, which means the p-value’s less than 0.001. Therefore the relation-
ship between years of education and Internet use is statistically significant. A
scatterplot of the data (not shown here) also indicates that the data appear
to have a positive linear relationship, so as you increase number of years of
education, Internet use also tends to increase (on average).
18_466469-ch12.indd 210 7/24/09 9:45:29 AM