
Page 233 - Statistics II for Dummies
P. 233
Chapter 12: Regression and ANOVA: Surprise Relatives! 217
because it describes the main part of the relationship between x and y. If the
slope of the line equals zero (you can’t reject Ho), you’re just left with y = a, a
horizontal line, and your model y = a + bx isn’t doing anything for you.
In ANOVA, you test to see whether the model fits by testing Ho: The means of
the populations are all equal versus Ha: At least two of the population means
aren’t equal. To do this you use an F-test (taking MST and dividing it by MSE;
see Chapter 9).
The sets of hypotheses in regression and ANOVA seem totally different, but in
essence, they’re both doing the same general thing: testing whether a certain
model fits. In the regression case, the model you want to see fit is the straight
line, and in the ANOVA case, the model of interest is a set of (normally distrib-
uted) populations with at least two different means (and the same variance).
Here each population is labeled as a treatment by ANOVA.
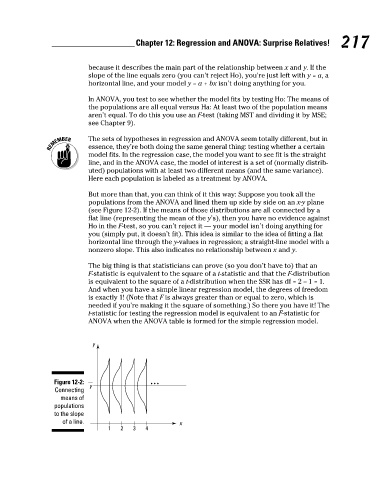
But more than that, you can think of it this way: Suppose you took all the
populations from the ANOVA and lined them up side by side on an x-y plane
(see Figure 12-2). If the means of those distributions are all connected by a
flat line (representing the mean of the y’s), then you have no evidence against
Ho in the F-test, so you can’t reject it — your model isn’t doing anything for
you (simply put, it doesn’t fit). This idea is similar to the idea of fitting a flat
horizontal line through the y-values in regression; a straight-line model with a
nonzero slope. This also indicates no relationship between x and y.
The big thing is that statisticians can prove (so you don’t have to) that an
F-statistic is equivalent to the square of a t-statistic and that the F-distribution
is equivalent to the square of a t-distribution when the SSR has df = 2 – 1 = 1.
And when you have a simple linear regression model, the degrees of freedom
is exactly 1! (Note that F is always greater than or equal to zero, which is
needed if you’re making it the square of something.) So there you have it! The
t-statistic for testing the regression model is equivalent to an F-statistic for
ANOVA when the ANOVA table is formed for the simple regression model.
y
Figure 12-2:
y
Connecting
means of
populations
to the slope
of a line. x
1 2 3 4
18_466469-ch12.indd 217 7/24/09 9:45:36 AM