
Page 241 - Statistics II for Dummies
P. 241
Chapter 13: Forming Associations with Two-Way Tables 225
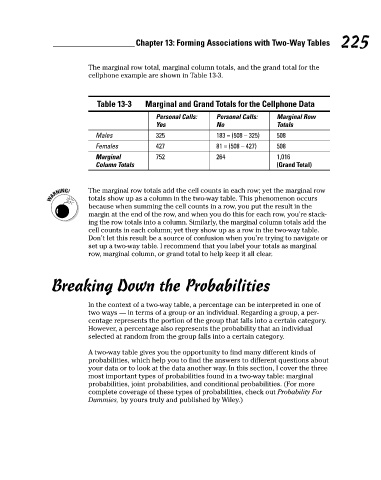
The marginal row total, marginal column totals, and the grand total for the
cellphone example are shown in Table 13-3.
Table 13-3 Marginal and Grand Totals for the Cellphone Data
Personal Calls: Personal Calls: Marginal Row
Yes No Totals
Males 325 183 = (508 – 325) 508
Females 427 81 = (508 – 427) 508
Marginal 752 264 1,016
Column Totals (Grand Total)
The marginal row totals add the cell counts in each row; yet the marginal row
totals show up as a column in the two-way table. This phenomenon occurs
because when summing the cell counts in a row, you put the result in the
margin at the end of the row, and when you do this for each row, you’re stack-
ing the row totals into a column. Similarly, the marginal column totals add the
cell counts in each column; yet they show up as a row in the two-way table.
Don’t let this result be a source of confusion when you’re trying to navigate or
set up a two-way table. I recommend that you label your totals as marginal
row, marginal column, or grand total to help keep it all clear.
Breaking Down the Probabilities
In the context of a two-way table, a percentage can be interpreted in one of
two ways — in terms of a group or an individual. Regarding a group, a per-
centage represents the portion of the group that falls into a certain category.
However, a percentage also represents the probability that an individual
selected at random from the group falls into a certain category.
A two-way table gives you the opportunity to find many different kinds of
probabilities, which help you to find the answers to different questions about
your data or to look at the data another way. In this section, I cover the three
most important types of probabilities found in a two-way table: marginal
probabilities, joint probabilities, and conditional probabilities. (For more
complete coverage of these types of probabilities, check out Probability For
Dummies, by yours truly and published by Wiley.)
20_466469-ch13.indd 225 7/24/09 9:47:55 AM