
Page 82 - Statistics and Data Analysis in Geology
P. 82
Statistics and Data Analysis in Geology - Chapter 3
Exercise 3.4
Coordinates can be rotated by a matrix multiplication in which the premultiplier is
a 2 x 2 matrix of sines and cosines of the angle of rotation,
COS~ sine I
[ -sine co~e
where 8 is the desired angle of rotation. Data in file PROSPECT.TXT were taken from
a surveyor's notebook describing the outline of a gold prospect in central Idaho.
Coordinates are given in meters from an arbitrary origin at the southwest corner of
the property and were measured relative to magnetic north. The magnetic declina-
tion in this area is 18'30' east of true north. Convert the surveyor's measurements
to coordinates relative to true north.
Exercise 3.5
Petrophysical well logs are strip charts made after the drilling of a well by lowering
a sonde down the hole and recording physical properties versus depth in the well.
Measurements include various electrical and sonic characteristics of the rocks, and
both natural and induced radioactivity. The measured values reflect the composi-
tion of the rocks and the fluids in the pore space.
File KANSALT.TXT contains data for depths between 980 and 1030 ft below
the surface in A.E.C. Test Hole No. 2, drilled in 1970 in Rice County, Kansas. At this
depth, the well penetrated the Hutchinson Salt member of the Permian Wellington
Formation, which was under investigation as a possible nuclear waste disposal site.
The Wellington Formation is composed entirely of varying proportions of halite, an-
hydrite, and shale. Pure samples of these end members have distinct physical prop-
erties, so appropriate log responses can be used to estimate the relative amounts
of halite, anhydrite, or shale at every foot within the Wellington Formation. A more
detailed discussion of these data is given in Doveton (1986).
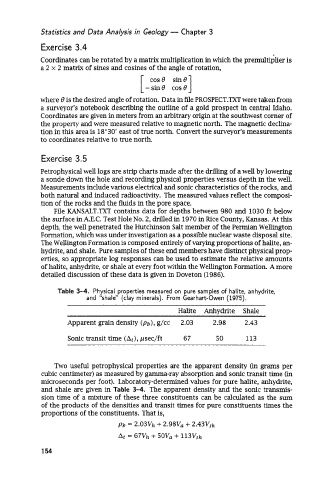
Table 3-4. Physical properties measured on pure samples of halite, anhydrite,
and "shale" (clay minerals). From Gearhart-Owen (1975).
Halite Anhydrite Shale
Apparent grain density (Pb), g/cc 2.03 2.98 2.43
Sonic transit time (At), psec/ft 67 50 113
Two useful petrophysical properties are the apparent density (in grams per
cubic centimeter) as measured by gamma-ray absorption and sonic transit time (in
microseconds per foot). Laboratory-determined values for pure halite, anhydrite,
and shale are given in Table 3-4. The apparent density and the sonic transmis-
sion time of a mixture of these three constituents can be calculated as the sum
of the products of the densities and transit times for pure constituents times the
proportions of the constituents. That is,
Pb = 2.03Vh + 2.98Va -?- 2.43vsh
At = 67Vh + SOVa + 113vsh
154