
Page 104 - Statistics for Dummies
P. 104
88
Part II: Number-Crunching Basics
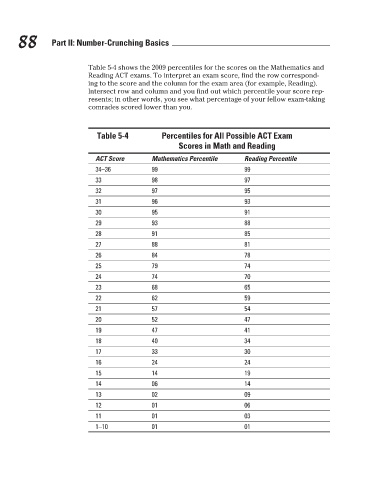
Table 5-4 shows the 2009 percentiles for the scores on the Mathematics and
Reading ACT exams. To interpret an exam score, find the row correspond-
ing to the score and the column for the exam area (for example, Reading).
Intersect row and column and you find out which percentile your score rep-
resents; in other words, you see what percentage of your fellow exam-taking
comrades scored lower than you.
Percentiles for All Possible ACT Exam
Table 5-4
Scores in Math and Reading
ACT Score
99
99
34–36
97
98
33
32
97
95
93
31 Mathematics Percentile Reading Percentile
96
30 95 91
29 93 88
28 91 85
27 88 81
26 84 78
25 79 74
24 74 70
23 68 65
22 62 59
21 57 54
20 52 47
19 47 41
18 40 34
17 33 30
16 24 24
15 14 19
14 06 14
13 02 09
12 01 06
11 01 03
1–10 01 01
3/25/11 8:17 PM
10_9780470911082-ch05.indd 88 3/25/11 8:17 PM
10_9780470911082-ch05.indd 88