
Page 109 - Statistics for Dummies
P. 109
Chapter 6: Getting the Picture: Graphing Categorical Data
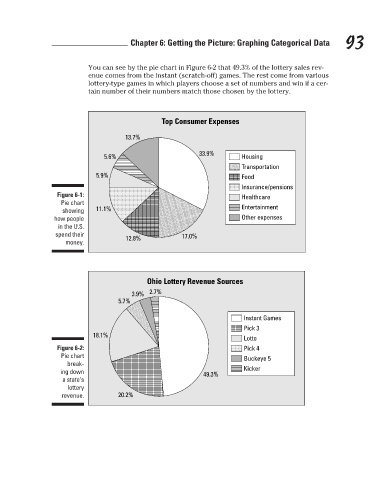
enue comes from the instant (scratch-off) games. The rest come from various
lottery-type games in which players choose a set of numbers and win if a cer-
tain number of their numbers match those chosen by the lottery.
Top Consumer Expenses
13.7%
33.9%
Housing
5.6%
Transportation
5.9%
Food
Insurance/pensions
Figure 6-1:
Healthcare
Pie chart You can see by the pie chart in Figure 6-2 that 49.3% of the lottery sales rev- 93
showing 11.1% Entertainment
how people Other expenses
in the U.S.
spend their 17.0%
12.8%
money.
Ohio Lottery Revenue Sources
3.9% 2.7%
5.7%
Instant Games
Pick 3
18.1%
Lotto
Figure 6-2: Pick 4
Pie chart Buckeye 5
break-
ing down 49.3% Kicker
a state’s
lottery
revenue. 20.2%
3/25/11 8:16 PM
11_9780470911082-ch06.indd 93 3/25/11 8:16 PM
11_9780470911082-ch06.indd 93