Page 156 - Statistics for Dummies
P. 156

140
                                         Part III: Distributions and the Central Limit Theorem
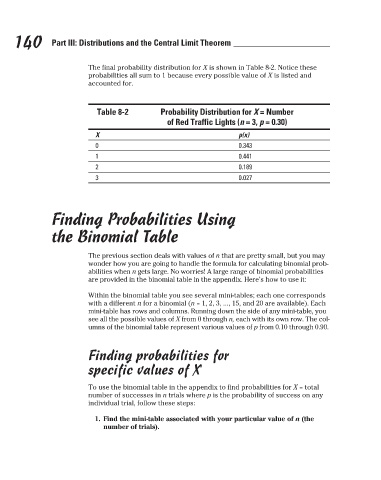
                                                    The final probability distribution for X is shown in Table 8-2. Notice these
                                                    probabilities all sum to 1 because every possible value of X is listed and
                                                    accounted for.
                                                                        Probability Distribution for X = Number
                                                      Table 8-2
                                                                          of Red Traffic Lights (n = 3, p = 0.30)

                                                      X
                                                      0
                                                                                              0.343
                                                      1
                                                                                              0.441
                                                                                              0.189
                                                      2
                                                      3
                                                                                              0.027
                                         Finding Probabilities Using                          p(x)
                                         the Binomial Table
                                                    The previous section deals with values of n that are pretty small, but you may
                                                    wonder how you are going to handle the formula for calculating binomial prob-
                                                    abilities when n gets large. No worries! A large range of binomial probabilities
                                                    are provided in the binomial table in the appendix. Here’s how to use it:
                                                    Within the binomial table you see several mini-tables; each one corresponds
                                                    with a different n for a binomial (n = 1, 2, 3, ..., 15, and 20 are available). Each
                                                    mini-table has rows and columns. Running down the side of any mini-table, you
                                                    see all the possible values of X from 0 through n, each with its own row. The col-
                                                    umns of the binomial table represent various values of p from 0.10 through 0.90.
                                                    Finding probabilities for
                                                    specific values of X
                                                    To use the binomial table in the appendix to find probabilities for X = total
                                                    number of successes in n trials where p is the probability of success on any
                                                    individual trial, follow these steps:

                                                      1. Find the mini-table associated with your particular value of n (the
                                                        number of trials).


                                                                                                                           3/25/11   8:16 PM
                             14_9780470911082-ch08.indd   140                                                              3/25/11   8:16 PM
                             14_9780470911082-ch08.indd   140
   151   152   153   154   155   156   157   158   159   160   161