Page 237 - Statistics for Dummies
P. 237

Chapter 14: Claims, Tests, and Conclusions
                                                    “how far is far” by looking at where your test statistic ends up on the distribu-
                                                    tion that it came from. When testing one population mean, under certain condi-
                                                    tions the distribution of comparison is the standard normal (Z-) distribution,
                                                    which has a mean of 0 and a standard deviation of 1; I use it throughout this
                                                    section as an example. (See Chapter 9 to find out more about the Z-distribution.)
                                                   If your test statistic is close to 0, or at least within that range where most of the
                                                    results should fall, then you don’t have much evidence against the claim (H )
                                                                                                                    o
                                                    based on your data. If your test statistic is out in the tails of the standard normal
                                                    distribution (see Chapter 9 for more on tails), then your evidence against the claim
                                                    (H ) is great; this result has a very small chance of happening if the claim is true. In
                                                      o
                                                    other words, you have sufficient evidence against the claim (H ), and you reject H .
                                                                                                      o
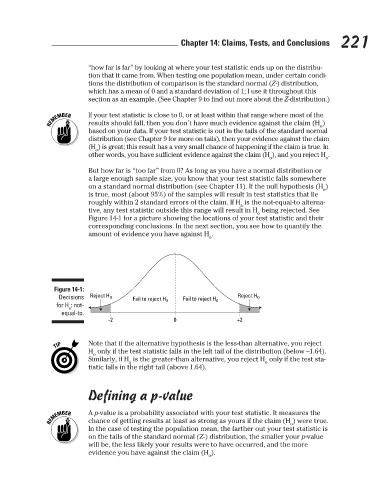
                                                    But how far is “too far” from 0? As long as you have a normal distribution or
                                                    a large enough sample size, you know that your test statistic falls somewhere
                                                    on a standard normal distribution (see Chapter 11). If the null hypothesis (H )
                                                    is true, most (about 95%) of the samples will result in test statistics that lie
                                                    roughly within 2 standard errors of the claim. If H  is the not-equal-to alterna- o o  221
                                                                                              a
                                                    tive, any test statistic outside this range will result in H  being rejected. See
                                                                                                   o
                                                    Figure 14-1 for a picture showing the locations of your test statistic and their
                                                    corresponding conclusions. In the next section, you see how to quantify the
                                                    amount of evidence you have against H .
                                                                                     o
                                          Figure 14-1:
                                           Decisions   Reject H O                            Reject H O
                                                                Fail to reject H O  Fail to reject H O
                                           for H : not-
                                              a
                                            equal-to.
                                                         -2                0                 +2
                                                    Note that if the alternative hypothesis is the less-than alternative, you reject
                                                    H  only if the test statistic falls in the left tail of the distribution (below –1.64).
                                                     o
                                                    Similarly, if H  is the greater-than alternative, you reject H  only if the test sta-
                                                               a                                     o
                                                    tistic falls in the right tail (above 1.64).
                                                    Defining a p-value
                                                  A p-value is a probability associated with your test statistic. It measures the
                                                    chance of getting results at least as strong as yours if the claim (H ) were true.
                                                                                                            o
                                                    In the case of testing the population mean, the farther out your test statistic is
                                                    on the tails of the standard normal (Z-) distribution, the smaller your p-value
                                                    will be, the less likely your results were to have occurred, and the more
                                                    evidence you have against the claim (H ).
                                                                                     o
                                                                                                                           3/25/11   8:14 PM
                             21_9780470911082-ch14.indd   221
                             21_9780470911082-ch14.indd   221                                                              3/25/11   8:14 PM
   232   233   234   235   236   237   238   239   240   241   242