
Page 338 - Statistics for Dummies
P. 338
322
Part VI: The Part of Tens
No
33.0%
a
Voter Opinion on Issue 1 (n = 500)
Percentage of voters
10 70 60 50 40 30 20 67.0% Voter Opinion on Issue 1 (n = 500) Yes
0
Yes No
Opinion
b
Percentage of Yes Voters 2002–2010
80
Percentage of yes voters 70 60 50
40
30
2002 2004 2006 2008 2010
Year
c
Age of Voters (n = 500)
3.0
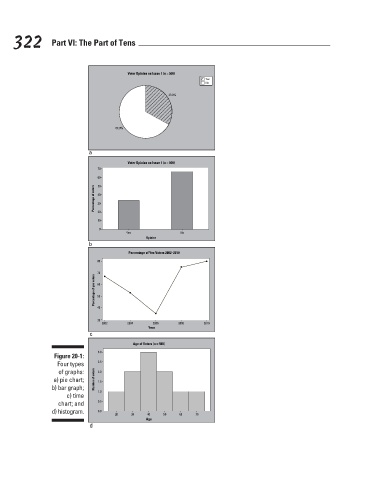
Figure 20-1:
Four types 2.5
of graphs: 2.0
a) pie chart; Number of voters 1.5
b) bar graph;
1.0
c) time
chart; and 0.5
d) histogram. 0.0
20 30 40 50 60 70
Age
d
3/25/11 8:12 PM
29_9780470911082-ch20.indd 322 3/25/11 8:12 PM
29_9780470911082-ch20.indd 322