
Page 71 - Statistics for Dummies
P. 71
Chapter 4: Tools of the Trade
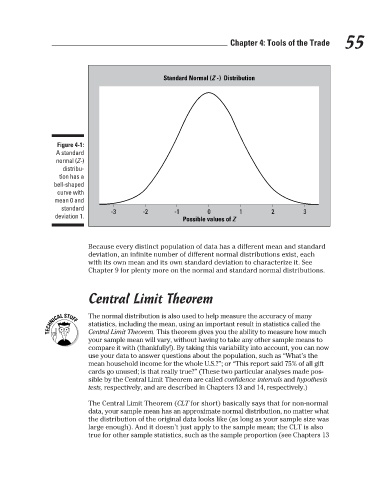
Figure 4-1:
A standard
normal (Z-)
distribu-
tion has a
bell-shaped
curve with
mean 0 and
standard -3 -2 Standard Normal (Z-) Distribution 2 3 55
0
-1
1
deviation 1. Possible values of Z
Because every distinct population of data has a different mean and standard
deviation, an infinite number of different normal distributions exist, each
with its own mean and its own standard deviation to characterize it. See
Chapter 9 for plenty more on the normal and standard normal distributions.
Central Limit Theorem
The normal distribution is also used to help measure the accuracy of many
statistics, including the mean, using an important result in statistics called the
Central Limit Theorem. This theorem gives you the ability to measure how much
your sample mean will vary, without having to take any other sample means to
compare it with (thankfully!). By taking this variability into account, you can now
use your data to answer questions about the population, such as “What’s the
mean household income for the whole U.S.?”; or “This report said 75% of all gift
cards go unused; is that really true?” (These two particular analyses made pos-
sible by the Central Limit Theorem are called confidence intervals and hypothesis
tests, respectively, and are described in Chapters 13 and 14, respectively.)
The Central Limit Theorem (CLT for short) basically says that for non-normal
data, your sample mean has an approximate normal distribution, no matter what
the distribution of the original data looks like (as long as your sample size was
large enough). And it doesn’t just apply to the sample mean; the CLT is also
true for other sample statistics, such as the sample proportion (see Chapters 13
3/25/11 8:17 PM
08_9780470911082-ch04.indd 55 3/25/11 8:17 PM
08_9780470911082-ch04.indd 55