Page 85 - Statistics for Dummies
P. 85

Chapter 5: Means, Medians, and More
                                                    survey of 2,000 teenagers included 1,200 females and 800 males, the resulting
                                                    percentages would be (1,200 ÷ 2,000) ∗ 100% = 60% female and (800 ÷ 2,000) ∗
                                                    100% = 40% male.
                                                    You can break down categorical data further by creating something called
                                                    two-way tables. Two-way tables (also called crosstabs) are tables with rows
                                                    and columns. They summarize the information from two categorical variables
                                                    at once, such as gender and political party, so you can see (or easily calcu-
                                                    late) the percentage of individuals in each combination of categories and use
                                                    them to make comparisons between groups.
                                                    For example, if you had data about the gender and political party of your
                                                    respondents, you would be able to look at the percentage of Republican
                                                    females, Republican males, Democratic females, Democratic males, and so
                                                    on. In this example, the total number of possible combinations in your table
                                                    would be 2 ∗ 4 = 8, or the total number of gender categories times the total
                                                    number of party affiliation categories. (See Chapter 19 for the full scoop, and   69
                                                    then some, on two-way tables.)
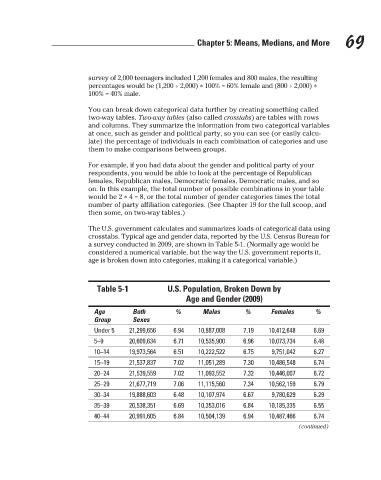
                                                    The U.S. government calculates and summarizes loads of categorical data using
                                                    crosstabs. Typical age and gender data, reported by the U.S. Census Bureau for
                                                    a survey conducted in 2009, are shown in Table 5-1. (Normally age would be
                                                    considered a numerical variable, but the way the U.S. government reports it,
                                                    age is broken down into categories, making it a categorical variable.)
                                                      Table 5-1           U.S. Population, Broken Down by
                                                                               Age and Gender (2009)
                                                     Age        Both        %       Males      %       Females     %
                                                     Group      Sexes
                                                     Under 5   21,299,656  6.94   10,887,008   7.19   10,412,648  6.69
                                                     5–9       20,609,634  6.71   10,535,900   6.96   10,073,734  6.48
                                                     10–14     19,973,564  6.51   10,222,522   6.75    9,751,042  6.27
                                                     15–19     21,537,837  7.02   11,051,289   7.30   10,486,548  6.74
                                                     20–24     21,539,559  7.02   11,093,552   7.32   10,446,007  6.72
                                                     25–29     21,677,719  7.06   11,115,560   7.34   10,562,159  6.79
                                                     30–34     19,888,603  6.48   10,107,974   6.67    9,780,629  6.29
                                                     35–39     20,538,351  6.69   10,353,016   6.84   10,185,335  6.55
                                                     40–44     20,991,605  6.84   10,504,139   6.94   10,487,466  6.74
                                                                                                              (continued)


                                                                                                                           3/25/11   8:17 PM
                             10_9780470911082-ch05.indd   69
                             10_9780470911082-ch05.indd   69                                                               3/25/11   8:17 PM
   80   81   82   83   84   85   86   87   88   89   90