
Page 89 - Statistics for Dummies
P. 89
Chapter 5: Means, Medians, and More
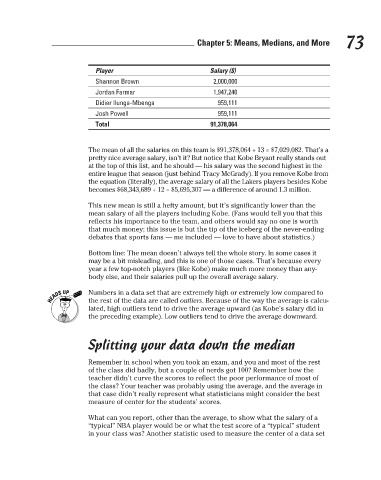
Player
Salary ($)
Shannon Brown
2,000,000
1,947,240
Jordan Farmar
Didier Ilunga-Mbenga
959,111
Josh Powell
959,111
91,378,064
Total
The mean of all the salaries on this team is $91,378,064 ÷ 13 = $7,029,082. That’s a
pretty nice average salary, isn’t it? But notice that Kobe Bryant really stands out
at the top of this list, and he should — his salary was the second highest in the
entire league that season (just behind Tracy McGrady). If you remove Kobe from
the equation (literally), the average salary of all the Lakers players besides Kobe
becomes $68,343,689 ÷ 12 = $5,695,307 — a difference of around 1.3 million.
This new mean is still a hefty amount, but it’s significantly lower than the 73
mean salary of all the players including Kobe. (Fans would tell you that this
reflects his importance to the team, and others would say no one is worth
that much money; this issue is but the tip of the iceberg of the never-ending
debates that sports fans — me included — love to have about statistics.)
Bottom line: The mean doesn’t always tell the whole story. In some cases it
may be a bit misleading, and this is one of those cases. That’s because every
year a few top-notch players (like Kobe) make much more money than any-
body else, and their salaries pull up the overall average salary.
Numbers in a data set that are extremely high or extremely low compared to
the rest of the data are called outliers. Because of the way the average is calcu-
lated, high outliers tend to drive the average upward (as Kobe’s salary did in
the preceding example). Low outliers tend to drive the average downward.
Splitting your data down the median
Remember in school when you took an exam, and you and most of the rest
of the class did badly, but a couple of nerds got 100? Remember how the
teacher didn’t curve the scores to reflect the poor performance of most of
the class? Your teacher was probably using the average, and the average in
that case didn’t really represent what statisticians might consider the best
measure of center for the students’ scores.
What can you report, other than the average, to show what the salary of a
“typical” NBA player would be or what the test score of a “typical” student
in your class was? Another statistic used to measure the center of a data set
3/25/11 8:17 PM
10_9780470911082-ch05.indd 73 3/25/11 8:17 PM
10_9780470911082-ch05.indd 73