
Page 93 - Statistics for Dummies
P. 93
Chapter 5: Means, Medians, and More
By far the most common measure of variation for numerical data is the stan-
dard deviation. The standard deviation measures how concentrated the data
are around the mean; the more concentrated, the smaller the standard devia-
tion. It’s not reported nearly as often as it should be, but when it is, you often
see it in parentheses: (s = 2.68).
Calculating standard deviation
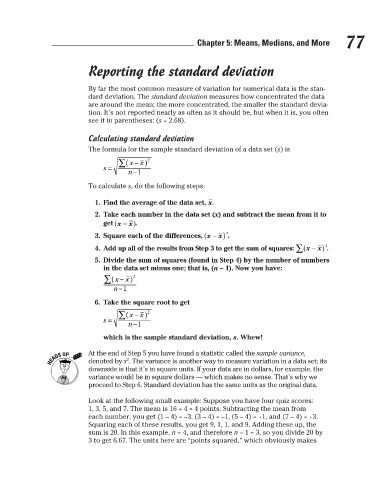
The formula for the sample standard deviation of a data set (s) is
To calculate s, do the following steps:
Reporting the standard deviation 77
1. Find the average of the data set, .
2. Take each number in the data set (x) and subtract the mean from it to
get .
3. Square each of the differences, .
4. Add up all of the results from Step 3 to get the sum of squares: .
5. Divide the sum of squares (found in Step 4) by the number of numbers
in the data set minus one; that is, (n – 1). Now you have:
6. Take the square root to get
which is the sample standard deviation, s. Whew!
At the end of Step 5 you have found a statistic called the sample variance,
2
denoted by s . The variance is another way to measure variation in a data set; its
downside is that it’s in square units. If your data are in dollars, for example, the
variance would be in square dollars — which makes no sense. That’s why we
proceed to Step 6. Standard deviation has the same units as the original data.
Look at the following small example: Suppose you have four quiz scores:
1, 3, 5, and 7. The mean is 16 ÷ 4 = 4 points. Subtracting the mean from
each number, you get (1 – 4) = –3, (3 – 4) = –1, (5 – 4) = +1, and (7 – 4) = +3.
Squaring each of these results, you get 9, 1, 1, and 9. Adding these up, the
sum is 20. In this example, n = 4, and therefore n – 1 = 3, so you divide 20 by
3 to get 6.67. The units here are “points squared,” which obviously makes
3/25/11 8:17 PM
10_9780470911082-ch05.indd 77 3/25/11 8:17 PM
10_9780470911082-ch05.indd 77