
Page 92 - Statistics for Dummies
P. 92
76
Part II: Number-Crunching Basics
2
1
C
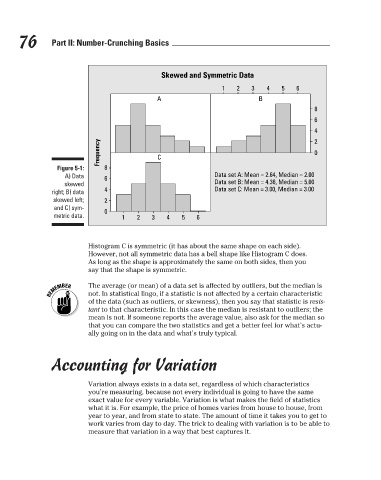
Figure 5-1:
Data set A: Mean = 2.64, Median = 2.00
A) Data
Data set B: Mean = 4.36, Median = 5.00
skewed
Data set C: Mean = 3.00, Median = 3.00
right; B) data
skewed left;
and C) sym- Frequency 8 6 4 2 A Skewed and Symmetric Data 3 B 4 5 6 8 6 4 2 0
0
metric data. 1 2 3 4 5 6
Histogram C is symmetric (it has about the same shape on each side).
However, not all symmetric data has a bell shape like Histogram C does.
As long as the shape is approximately the same on both sides, then you
say that the shape is symmetric.
The average (or mean) of a data set is affected by outliers, but the median is
not. In statistical lingo, if a statistic is not affected by a certain characteristic
of the data (such as outliers, or skewness), then you say that statistic is resis-
tant to that characteristic. In this case the median is resistant to outliers; the
mean is not. If someone reports the average value, also ask for the median so
that you can compare the two statistics and get a better feel for what’s actu-
ally going on in the data and what’s truly typical.
Accounting for Variation
Variation always exists in a data set, regardless of which characteristics
you’re measuring, because not every individual is going to have the same
exact value for every variable. Variation is what makes the field of statistics
what it is. For example, the price of homes varies from house to house, from
year to year, and from state to state. The amount of time it takes you to get to
work varies from day to day. The trick to dealing with variation is to be able to
measure that variation in a way that best captures it.
3/25/11 8:17 PM
10_9780470911082-ch05.indd 76 3/25/11 8:17 PM
10_9780470911082-ch05.indd 76