
Page 57 - Successful Onboarding
P. 57
46 • Successful Onboarding
Onboarding Margin: Productivity Effects
Now we wanted to move on to the productivity opportunity. We assumed
that 90% of new hires were retained into their second year. Additionally,
based on extensive secondary research, we found it reasonable to assume
that 25% of retained employees were operating at an average of 50% opti-
mal productivity levels. Although other sources suggest that a far larger
percentage of retained new hires operate at lower productivity rates, we
selected a lower percentage to arrive at a more conservative calculation.
Then we assumed that the remaining 75% of second-year new hires were
operating at the maximum productivity level (100%). Again, the idea
that this many (75%) new hires are operating at 100% productivity in
year two appears conservative by all accounts from our experience or
feedback.
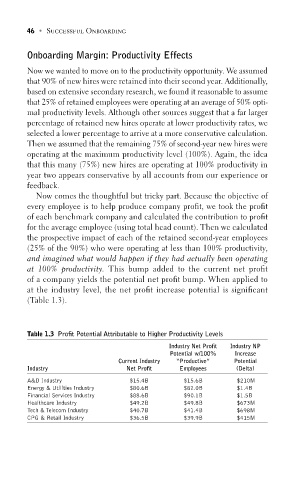
Now comes the thoughtful but tricky part. Because the objective of
every employee is to help produce company profit, we took the profit
of each benchmark company and calculated the contribution to profit
for the average employee (using total head count). Then we calculated
the prospective impact of each of the retained second-year employees
(25% of the 90%) who were operating at less than 100% productivity,
and imagined what would happen if they had actually been operating
at 100% productivity. This bump added to the current net profit
of a company yields the potential net profit bump. When applied to
at the industry level, the net profit increase potential is significant
(Table 1.3).
Table 1.3 Profit Potential Attributable to Higher Productivity Levels
Industry Net Profit Industry NP
Potential w/100% Increase
Current Industry “Productive” Potential
Industry Net Profit Employees (Delta)
A&D Industry $15.4B $15.6B $210M
Energy & Utilities Industry $80.6B $82.0B $1.4B
Financial Services Industry $88.6B $90.1B $1.5B
Healthcare Industry $49.2B $49.8B $673M
Tech & Telecom Industry $40.7B $41.4B $698M
CPG & Retail Industry $36.5B $39.9B $415M