
Page 217 - Sustainability in the Process Industry Integration and Optimization
P. 217
194 Cha p te r N i n e
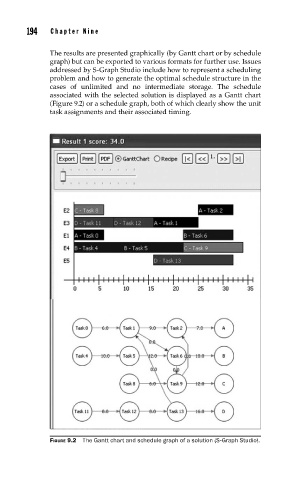
The results are presented graphically (by Gantt chart or by schedule
graph) but can be exported to various formats for further use. Issues
addressed by S-Graph Studio include how to represent a scheduling
problem and how to generate the optimal schedule structure in the
cases of unlimited and no intermediate storage. The schedule
associated with the selected solution is displayed as a Gantt chart
(Figure 9.2) or a schedule graph, both of which clearly show the unit
task assignments and their associated timing.
FIGURE 9.2 The Gantt chart and schedule graph of a solution (S-Graph Studio).