
Page 177 - Sustainability in the process industry
P. 177
154 Cha p te r S e v e n
structural properties for process networks to be feasible. The
algorithms are able to guarantee the resultant mathematical model’s
validity, reduce the search space, and generate the optimal solution.
7.2.1 Process Representation via P-Graphs
In a P-graph, one class of nodes is assigned to operating units or
activities and the other is assigned to their inputs and outputs. Raw
materials, resources (precursors), and preconditions (activating
entities) are inputs to the operating units; products, effects (resulting
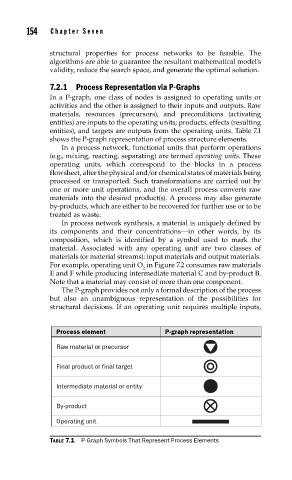
entities), and targets are outputs from the operating units. Table 7.1
shows the P-graph representation of process structure elements.
In a process network, functional units that perform operations
(e.g., mixing, reacting, separating) are termed operating units. These
operating units, which correspond to the blocks in a process
flowsheet, alter the physical and/or chemical states of materials being
processed or transported. Such transformations are carried out by
one or more unit operations, and the overall process converts raw
materials into the desired product(s). A process may also generate
by-products, which are either to be recovered for further use or to be
treated as waste.
In process network synthesis, a material is uniquely defined by
its components and their concentrations—in other words, by its
composition, which is identified by a symbol used to mark the
material. Associated with any operating unit are two classes of
materials (or material streams): input materials and output materials.
For example, operating unit O in Figure 7.2 consumes raw materials
2
E and F while producing intermediate material C and by-product B.
Note that a material may consist of more than one component.
The P-graph provides not only a formal description of the process
but also an unambiguous representation of the possibilities for
structural decisions. If an operating unit requires multiple inputs,
Process element P-graph representation
Raw material or precursor
Final product or final target
Intermediate material or entity
By-product
Operating unit
TABLE 7.1 P-Graph Symbols That Represent Process Elements