
Page 178 - Sustainability in the process industry
P. 178
Pro c ess O p timization F r ame w ork s 155
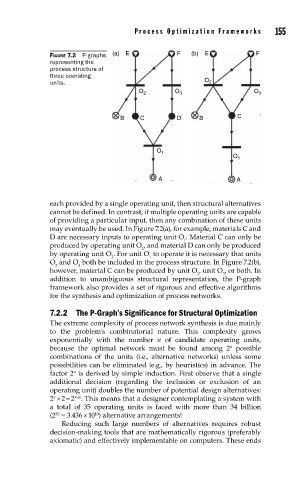
FIGURE 7.2 P-graphs (a) E F (b) E F
representing the
process structure of
three operating
units. O 2
O 2 O 3 O 3
B C D B C
O 1
O 1
A A
each provided by a single operating unit, then structural alternatives
cannot be defined. In contrast, if multiple operating units are capable
of providing a particular input, then any combination of these units
may eventually be used. In Figure 7.2(a), for example, materials C and
D are necessary inputs to operating unit O . Material C can only be
1
produced by operating unit O , and material D can only be produced
2
by operating unit O . For unit O to operate it is necessary that units
3 1
O and O both be included in the process structure. In Figure 7.2(b),
2 3
however, material C can be produced by unit O , unit O , or both. In
1 3
addition to unambiguous structural representation, the P-graph
framework also provides a set of rigorous and effective algorithms
for the synthesis and optimization of process networks.
7.2.2 The P-Graph’s Significance for Structural Optimization
The extreme complexity of process network synthesis is due mainly
to the problem’s combinatorial nature. This complexity grows
exponentially with the number n of candidate operating units,
n
because the optimal network must be found among 2 possible
combinations of the units (i.e., alternative networks) unless some
possibilities can be eliminated (e.g., by heuristics) in advance. The
factor 2 is derived by simple induction. First observe that a single
n
additional decision (regarding the inclusion or exclusion of an
operating unit) doubles the number of potential design alternatives:
n+1
2 × 2 = 2 . This means that a designer contemplating a system with
n
a total of 35 operating units is faced with more than 34 billion
10
35
(2 = 3.436 × 10 ) alternative arrangements!
Reducing such large numbers of alternatives requires robust
decision-making tools that are mathematically rigorous (preferably
axiomatic) and effectively implementable on computers. These ends