
Page 125 - Sustainable Cities and Communities Design Handbook
P. 125
102 Sustainable Cities and Communities Design Handbook
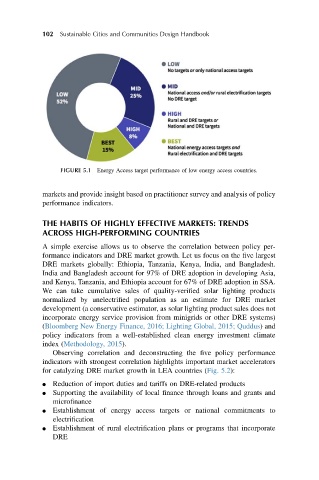
FIGURE 5.1 Energy Access target performance of low energy access countries.
markets and provide insight based on practitioner survey and analysis of policy
performance indicators.
THE HABITS OF HIGHLY EFFECTIVE MARKETS: TRENDS
ACROSS HIGH-PERFORMING COUNTRIES
A simple exercise allows us to observe the correlation between policy per-
formance indicators and DRE market growth. Let us focus on the five largest
DRE markets globally: Ethiopia, Tanzania, Kenya, India, and Bangladesh.
India and Bangladesh account for 97% of DRE adoption in developing Asia,
and Kenya, Tanzania, and Ethiopia account for 67% of DRE adoption in SSA.
We can take cumulative sales of quality-verified solar lighting products
normalized by unelectrified population as an estimate for DRE market
development (a conservative estimator, as solar lighting product sales does not
incorporate energy service provision from minigrids or other DRE systems)
(Bloomberg New Energy Finance, 2016; Lighting Global, 2015; Quddus) and
policy indicators from a well-established clean energy investment climate
index (Methodology, 2015).
Observing correlation and deconstructing the five policy performance
indicators with strongest correlation highlights important market accelerators
for catalyzing DRE market growth in LEA countries (Fig. 5.2):
l Reduction of import duties and tariffs on DRE-related products
l Supporting the availability of local finance through loans and grants and
microfinance
l Establishment of energy access targets or national commitments to
electrification
l Establishment of rural electrification plans or programs that incorporate
DRE