
Page 541 - Sustainable Cities and Communities Design Handbook
P. 541
510 Sustainable Cities and Communities Design Handbook
the same time leads to an increase of N 2 O leaching in soil and water bodies,
caused by grazing livestock excreta. Extensive grazing, in addition, lowers the
soil productivity (yield gap) and requires a higher amount of land to reach the
same output level.
Intensive husbandry allows the efficient treatment of manure at farmyard
level (e.g., biogas production); however, it implies intensive agriculture as well
on the fields surrounding. This may lead to an increase in N 2 O leaching in the
soil due to an increase in fertilizer use and pesticide pollution (which
conversely are not used in grazing systems).
GHG reduction may be easily combined only with intensive farming
contributing to a renewable energy production and a lower emission caused by
the digested mass spread on soil.
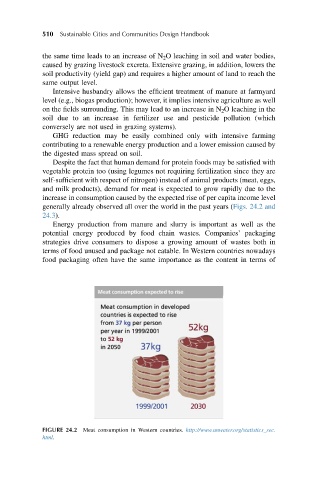
Despite the fact that human demand for protein foods may be satisfied with
vegetable protein too (using legumes not requiring fertilization since they are
self-sufficient with respect of nitrogen) instead of animal products (meat, eggs,
and milk products), demand for meat is expected to grow rapidly due to the
increase in consumption caused by the expected rise of per capita income level
generally already observed all over the world in the past years (Figs. 24.2 and
24.3).
Energy production from manure and slurry is important as well as the
potential energy produced by food chain wastes. Companies’ packaging
strategies drive consumers to dispose a growing amount of wastes both in
terms of food unused and package not eatable. In Western countries nowadays
food packaging often have the same importance as the content in terms of
FIGURE 24.2 Meat consumption in Western countries. http://www.unwater.org/statistics_sec.
html.