
Page 130 - Sustainable On-Site CHP Systems Design, Construction, and Operations
P. 130
108 CHP B a s i c s
systems. The use of a solid fuel, such as coal or biomass, for CHP systems, though
feasible for some applications, is rare. This chapter primarily discusses emissions of
CO and NO from reciprocating engines and combustion turbines.
2 x
Carbon Footprint of Electric Power Production
Combustion of all fossil fuels results in the emissions of CO , which is considered to be
2
a major greenhouse gas (GHG). Many studies have related global warming and climate
change to the emissions of CO . Significant worldwide efforts are underway to reduce
2
the emissions of CO , including those from the use of fossil fuels for electric power pro-
2
duction and for providing thermal energy needs.
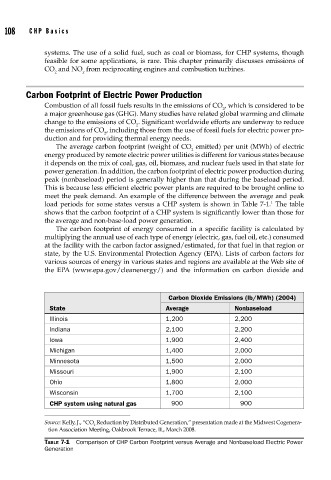
The average carbon footprint (weight of CO emitted) per unit (MWh) of electric
2
energy produced by remote electric power utilities is different for various states because
it depends on the mix of coal, gas, oil, biomass, and nuclear fuels used in that state for
power generation. In addition, the carbon footprint of electric power production during
peak (nonbaseload) period is generally higher than that during the baseload period.
This is because less efficient electric power plants are required to be brought online to
meet the peak demand. An example of the difference between the average and peak
1
load periods for some states versus a CHP system is shown in Table 7-1. The table
shows that the carbon footprint of a CHP system is significantly lower than those for
the average and non-base-load power generation.
The carbon footprint of energy consumed in a specific facility is calculated by
multiplying the annual use of each type of energy (electric, gas, fuel oil, etc.) consumed
at the facility with the carbon factor assigned/estimated, for that fuel in that region or
state, by the U.S. Environmental Protection Agency (EPA). Lists of carbon factors for
various sources of energy in various states and regions are available at the Web site of
the EPA (www.epa.gov/cleanenergy/) and the information on carbon dioxide and
Carbon Dioxide Emissions (lb/MWh) (2004)
State Average Nonbaseload
Illinois 1,200 2,200
Indiana 2,100 2,200
Iowa 1,900 2,400
Michigan 1,400 2,000
Minnesota 1,500 2,000
Missouri 1,900 2,100
Ohio 1,800 2,000
Wisconsin 1,700 2,100
CHP system using natural gas 900 900
Source: Kelly, J., “CO Reduction by Distributed Generation,” presentation made at the Midwest Cogenera-
2
tion Association Meeting, Oakbrook Terrace, IL, March 2008.
TABLE 7-1 Comparison of CHP Carbon Footprint versus Average and Nonbaseload Electric Power
Generation