
Page 279 - Sustainable On-Site CHP Systems Design, Construction, and Operations
P. 279
252 C o ns truction
Assumptions
about the
Sample of Modifications to take proposed project
past projects account of time and
quality
Current
information Proposed project
obtained from (quantitative and COST
specialists and qualitative) PLAN
suppliers
Forecast of future
inflation and
industrial workload
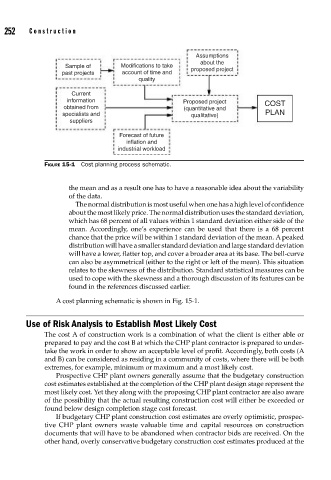
FIGURE 15-1 Cost planning process schematic.
the mean and as a result one has to have a reasonable idea about the variability
of the data.
The normal distribution is most useful when one has a high level of confidence
about the most likely price. The normal distribution uses the standard deviation,
which has 68 percent of all values within 1 standard deviation either side of the
mean. Accordingly, one’s experience can be used that there is a 68 percent
chance that the price will be within 1 standard deviation of the mean. A peaked
distribution will have a smaller standard deviation and large standard deviation
will have a lower, flatter top, and cover a broader area at its base. The bell-curve
can also be asymmetrical (either to the right or left of the mean). This situation
relates to the skewness of the distribution. Standard statistical measures can be
used to cope with the skewness and a thorough discussion of its features can be
found in the references discussed earlier.
A cost planning schematic is shown in Fig. 15-1.
Use of Risk Analysis to Establish Most Likely Cost
The cost A of construction work is a combination of what the client is either able or
prepared to pay and the cost B at which the CHP plant contractor is prepared to under-
take the work in order to show an acceptable level of profit. Accordingly, both costs (A
and B) can be considered as residing in a community of costs, where there will be both
extremes, for example, minimum or maximum and a most likely cost.
Prospective CHP plant owners generally assume that the budgetary construction
cost estimates established at the completion of the CHP plant design stage represent the
most likely cost. Yet they along with the proposing CHP plant contractor are also aware
of the possibility that the actual resulting construction cost will either be exceeded or
found below design completion stage cost forecast.
If budgetary CHP plant construction cost estimates are overly optimistic, prospec-
tive CHP plant owners waste valuable time and capital resources on construction
documents that will have to be abandoned when contractor bids are received. On the
other hand, overly conservative budgetary construction cost estimates produced at the