
Page 281 - Sustainable On-Site CHP Systems Design, Construction, and Operations
P. 281
254 C o ns truction
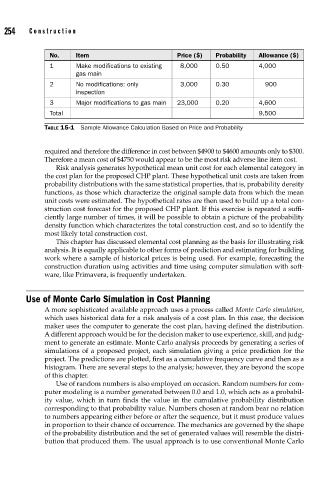
No. Item Price ($) Probability Allowance ($)
1 Make modifications to existing 8,000 0.50 4,000
gas main
2 No modifications: only 3,000 0.30 900
inspection
3 Major modifications to gas main 23,000 0.20 4,600
Total 9,500
TABLE 15-1 Sample Allowance Calculation Based on Price and Probability
required and therefore the difference in cost between $4900 to $4600 amounts only to $300.
Therefore a mean cost of $4750 would appear to be the most risk adverse line item cost.
Risk analysis generates hypothetical mean unit cost for each elemental category in
the cost plan for the proposed CHP plant. These hypothetical unit costs are taken from
probability distributions with the same statistical properties, that is, probability density
functions, as those which characterize the original sample data from which the mean
unit costs were estimated. The hypothetical rates are then used to build up a total con-
struction cost forecast for the proposed CHP plant. If this exercise is repeated a suffi-
ciently large number of times, it will be possible to obtain a picture of the probability
density function which characterizes the total construction cost, and so to identify the
most likely total construction cost.
This chapter has discussed elemental cost planning as the basis for illustrating risk
analysis. It is equally applicable to other forms of prediction and estimating for building
work where a sample of historical prices is being used. For example, forecasting the
construction duration using activities and time using computer simulation with soft-
ware, like Primavera, is frequently undertaken.
Use of Monte Carlo Simulation in Cost Planning
A more sophisticated available approach uses a process called Monte Carlo simulation,
which uses historical data for a risk analysis of a cost plan. In this case, the decision
maker uses the computer to generate the cost plan, having defined the distribution.
A different approach would be for the decision maker to use experience, skill, and judg-
ment to generate an estimate. Monte Carlo analysis proceeds by generating a series of
simulations of a proposed project, each simulation giving a price prediction for the
project. The predictions are plotted, first as a cumulative frequency curve and then as a
histogram. There are several steps to the analysis; however, they are beyond the scope
of this chapter.
Use of random numbers is also employed on occasion. Random numbers for com-
puter modeling is a number generated between 0.0 and 1.0, which acts as a probabil-
ity value, which in turn finds the value in the cumulative probability distribution
corresponding to that probability value. Numbers chosen at random bear no relation
to numbers appearing either before or after the sequence, but it must produce values
in proportion to their chance of occurrence. The mechanics are governed by the shape
of the probability distribution and the set of generated values will resemble the distri-
bution that produced them. The usual approach is to use conventional Monte Carlo