
Page 201 -
P. 201
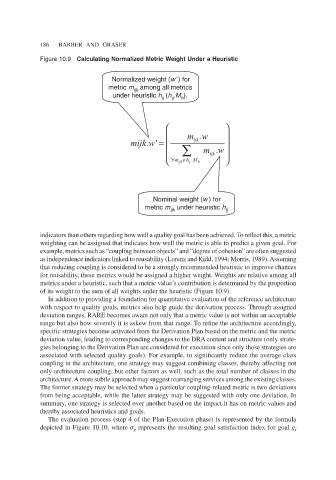
186 BARBER AND GRASER
Figure 10.9 Calculating Normalized Metric Weight Under a Heuristic
Normalized weight (w’ ) for
metric m among all metrics
ijk
under heuristic h (h .M ).
ij
ij
h
PZ
PLMN Z = LMN
∑ PZ
LMN
LMN P ∀ L M K ∈ K 0
Nominal weight (w ) for
metric m under heuristic h ij
ijk
indicators than others regarding how well a quality goal has been achieved. To reflect this, a metric
weighting can be assigned that indicates how well the metric is able to predict a given goal. For
example, metrics such as “coupling between objects” and “degree of cohesion” are often suggested
as independence indicators linked to reusability (Lorenz and Kidd, 1994; Morris, 1989). Assuming
that reducing coupling is considered to be a strongly recommended heuristic to improve chances
for reusability, these metrics would be assigned a higher weight. Weights are relative among all
metrics under a heuristic, such that a metric value’s contribution is determined by the proportion
of its weight to the sum of all weights under the heuristic (Figure 10.9).
In addition to providing a foundation for quantitative evaluation of the reference architecture
with respect to quality goals, metrics also help guide the derivation process. Through assigned
deviation ranges, RARE becomes aware not only that a metric value is not within an acceptable
range but also how severely it is askew from that range. To refine the architecture accordingly,
specific strategies become activated from the Derivation Plan based on the metric and the metric
deviation value, leading to corresponding changes to the DRA content and structure (only strate-
gies belonging to the Derivation Plan are considered for execution since only those strategies are
associated with selected quality goals). For example, to significantly reduce the average class
coupling in the architecture, one strategy may suggest combining classes, thereby affecting not
only architecture coupling, but other factors as well, such as the total number of classes in the
architecture. A more subtle approach may suggest rearranging services among the existing classes.
The former strategy may be selected when a particular coupling-related metric is two deviations
from being acceptable, while the latter strategy may be suggested with only one deviation. In
summary, one strategy is selected over another based on the impact it has on metric values and
thereby associated heuristics and goals.
The evaluation process (step 4 of the Plan-Execution phase) is represented by the formula
depicted in Figure 10.10, where σ represents the resulting goal satisfaction index for goal g
i
g