
Page 141 - TPM A Route to World-Class Performance
P. 141
120 TPM-A Route to Would-Class Performance
25’000 roo0
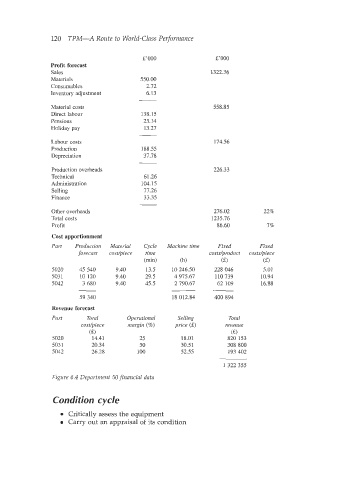
Profit forecast
Sales 1322.36
Materials 550.00
Consumables 2.72
Inventory adjustment 6.13
Material costs 558.85
Direct labour 138.15
Pensions 23.14
Holiday pay 13.27
Labour costs 174.56
Production 188.55
Depreciation 37.78
Production overheads 226.33
Technical 61.26
Administration 104.15
Selling 77.26
Finance 33.35
Other overheads 276.02 22%
Total costs 1235.76
Profit 86.60 7%
Cost apportionment
Part Production Material Cycle Machine time Fixed Fixed
forecast cost/piece time costs/product costs/piece
(min) (h) (E) (E)
5020 45540 9.40 13.5 10 246.50 228 046 5.01
5031 10 120 9.40 29.5 4 975.67 110 739 10.94
5042 3 680 9.40 45.5 2 790.67 62 109 16.88
59 340 18 012.84 400 894
Revenue forecast
Part Total Operational Selling Total
cost/piece margin (%) price (E) revenue
(E) (E)
5020 14.41 25 18.01 820 153
5031 20.34 50 30.51 308 800
5042 26.28 100 52.55 193 402
1 322 355
Figure 6.4 Department 50 financial data
Condition cycle
Critically assess the equipment
Carry out an appraisal of its condition