Page 149 - TPM A Route to World-Class Performance
P. 149

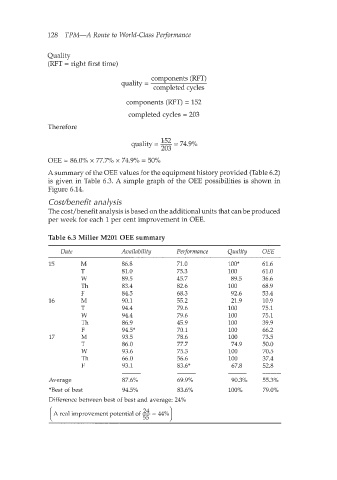
128  TPM-A  Route to World-Class Performance


               Quality
               (RFT = right first time)

                                              components (RFT)
                                     quality =
                                              completed cycles
                                      components (RFT) = 152
                                       completed cycles = 203

               Therefore
                                                 152
                                        quality = __ = 74.9%
                                                 203
               OEE = 86.0% x 77.7% x 74.9% = 50%
               A summary of the OEE values for the equipment history provided (Table 6.2)
               is given in Table 6.3. A simple graph of  the OEE possibilities is shown in
               Figure 6.14.
               Cos Vben e fi t a na lysis
               The cost/benefit analysis is based on the additional units that can be produced
               per week for each 1 per cent improvement in OEE.

               Table 6.3 Miller M201 OEE summary

                   Date              Availability    Performance    Quality    OEE
               15        M           86.8            71.0           loo*       61.6
                         T           81.0            75.3           100        61.0
                         W           89.5            45.7            89.5     36.6
                         Th          83.4            82.6           100        68.9
                         F           84.5            68.3            92.6      53.4
               16        M           90.1            55.2            21.9      10.9
                         T           94.4            79.6           100        75.1
                         W           94.4            79.6           100        75.1
                         Th          86.9            45.9           100        39.9
                         F           94.5*           70.1           100        66.2
               17        M           93.5            78.6           100        73.5
                         T           86.0            77.7            74.9      50.0
                         W           93.6            75.3            100       70.5
                         Th          66.0            56.6            100       37.4
                         F           93.1            83.6*           67.8      52.8
               Average               87.6%           69.9%           90.3%     55.3%
               *Best of  best        94.5%           83.6%          100%       79.0%
               Difference between best of  best and average: 24%

                 A real improvement potential of
   144   145   146   147   148   149   150   151   152   153   154