
Page 150 - TPM A Route to World-Class Performance
P. 150
Applying the TPM improvement plan 129
90 1-
World class
t
0 1 2 3 4
Implementation
(months)
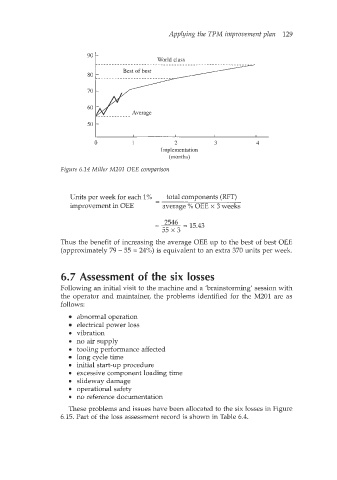
Figure 6.14 Miller M201 OEE comparison
Units per week for each 1% - total components (RFT)
-
improvement in OEE average O/O OEE x 3 weeks
- --
2546 - 15.43
-
55 x 3
Thus the benefit of increasing the average OEE up to the best of best OEE
(approximately 79 - 55 = 24%) is equivalent to an extra 370 units per week.
6.7 Assessment of the six losses
Following an initial visit to the machine and a 'brainstorming' session with
the operator and maintainer, the problems identified for the M201 are as
follows:
abnormal operation
electrical power loss
0 vibration
0 no airsupply
0 tooling performance affected
long cycle time
initial start-up procedure
excessive component loading time
slideway damage
operational safety
0 no reference domentation
These problems and issues have been allocated to the six losses in Figure
6.15. Part of the loss assessment record is shown in Table 6.4.